The U.S. Department of Labor announced unemployment numbers today, showing that for the week ending Nov. 30, seasonally adjusted initial jobless claims fell by 7.2% -- or 23,000 -- to 298,000. This is also well below the 370,000 that were reported in the comparable week last year, and marked an improvement of almost 20% year over year. After spiking in the first week of October, initial claims have been on a mostly steady decline over the past eight weeks, as can be see in the chart below:
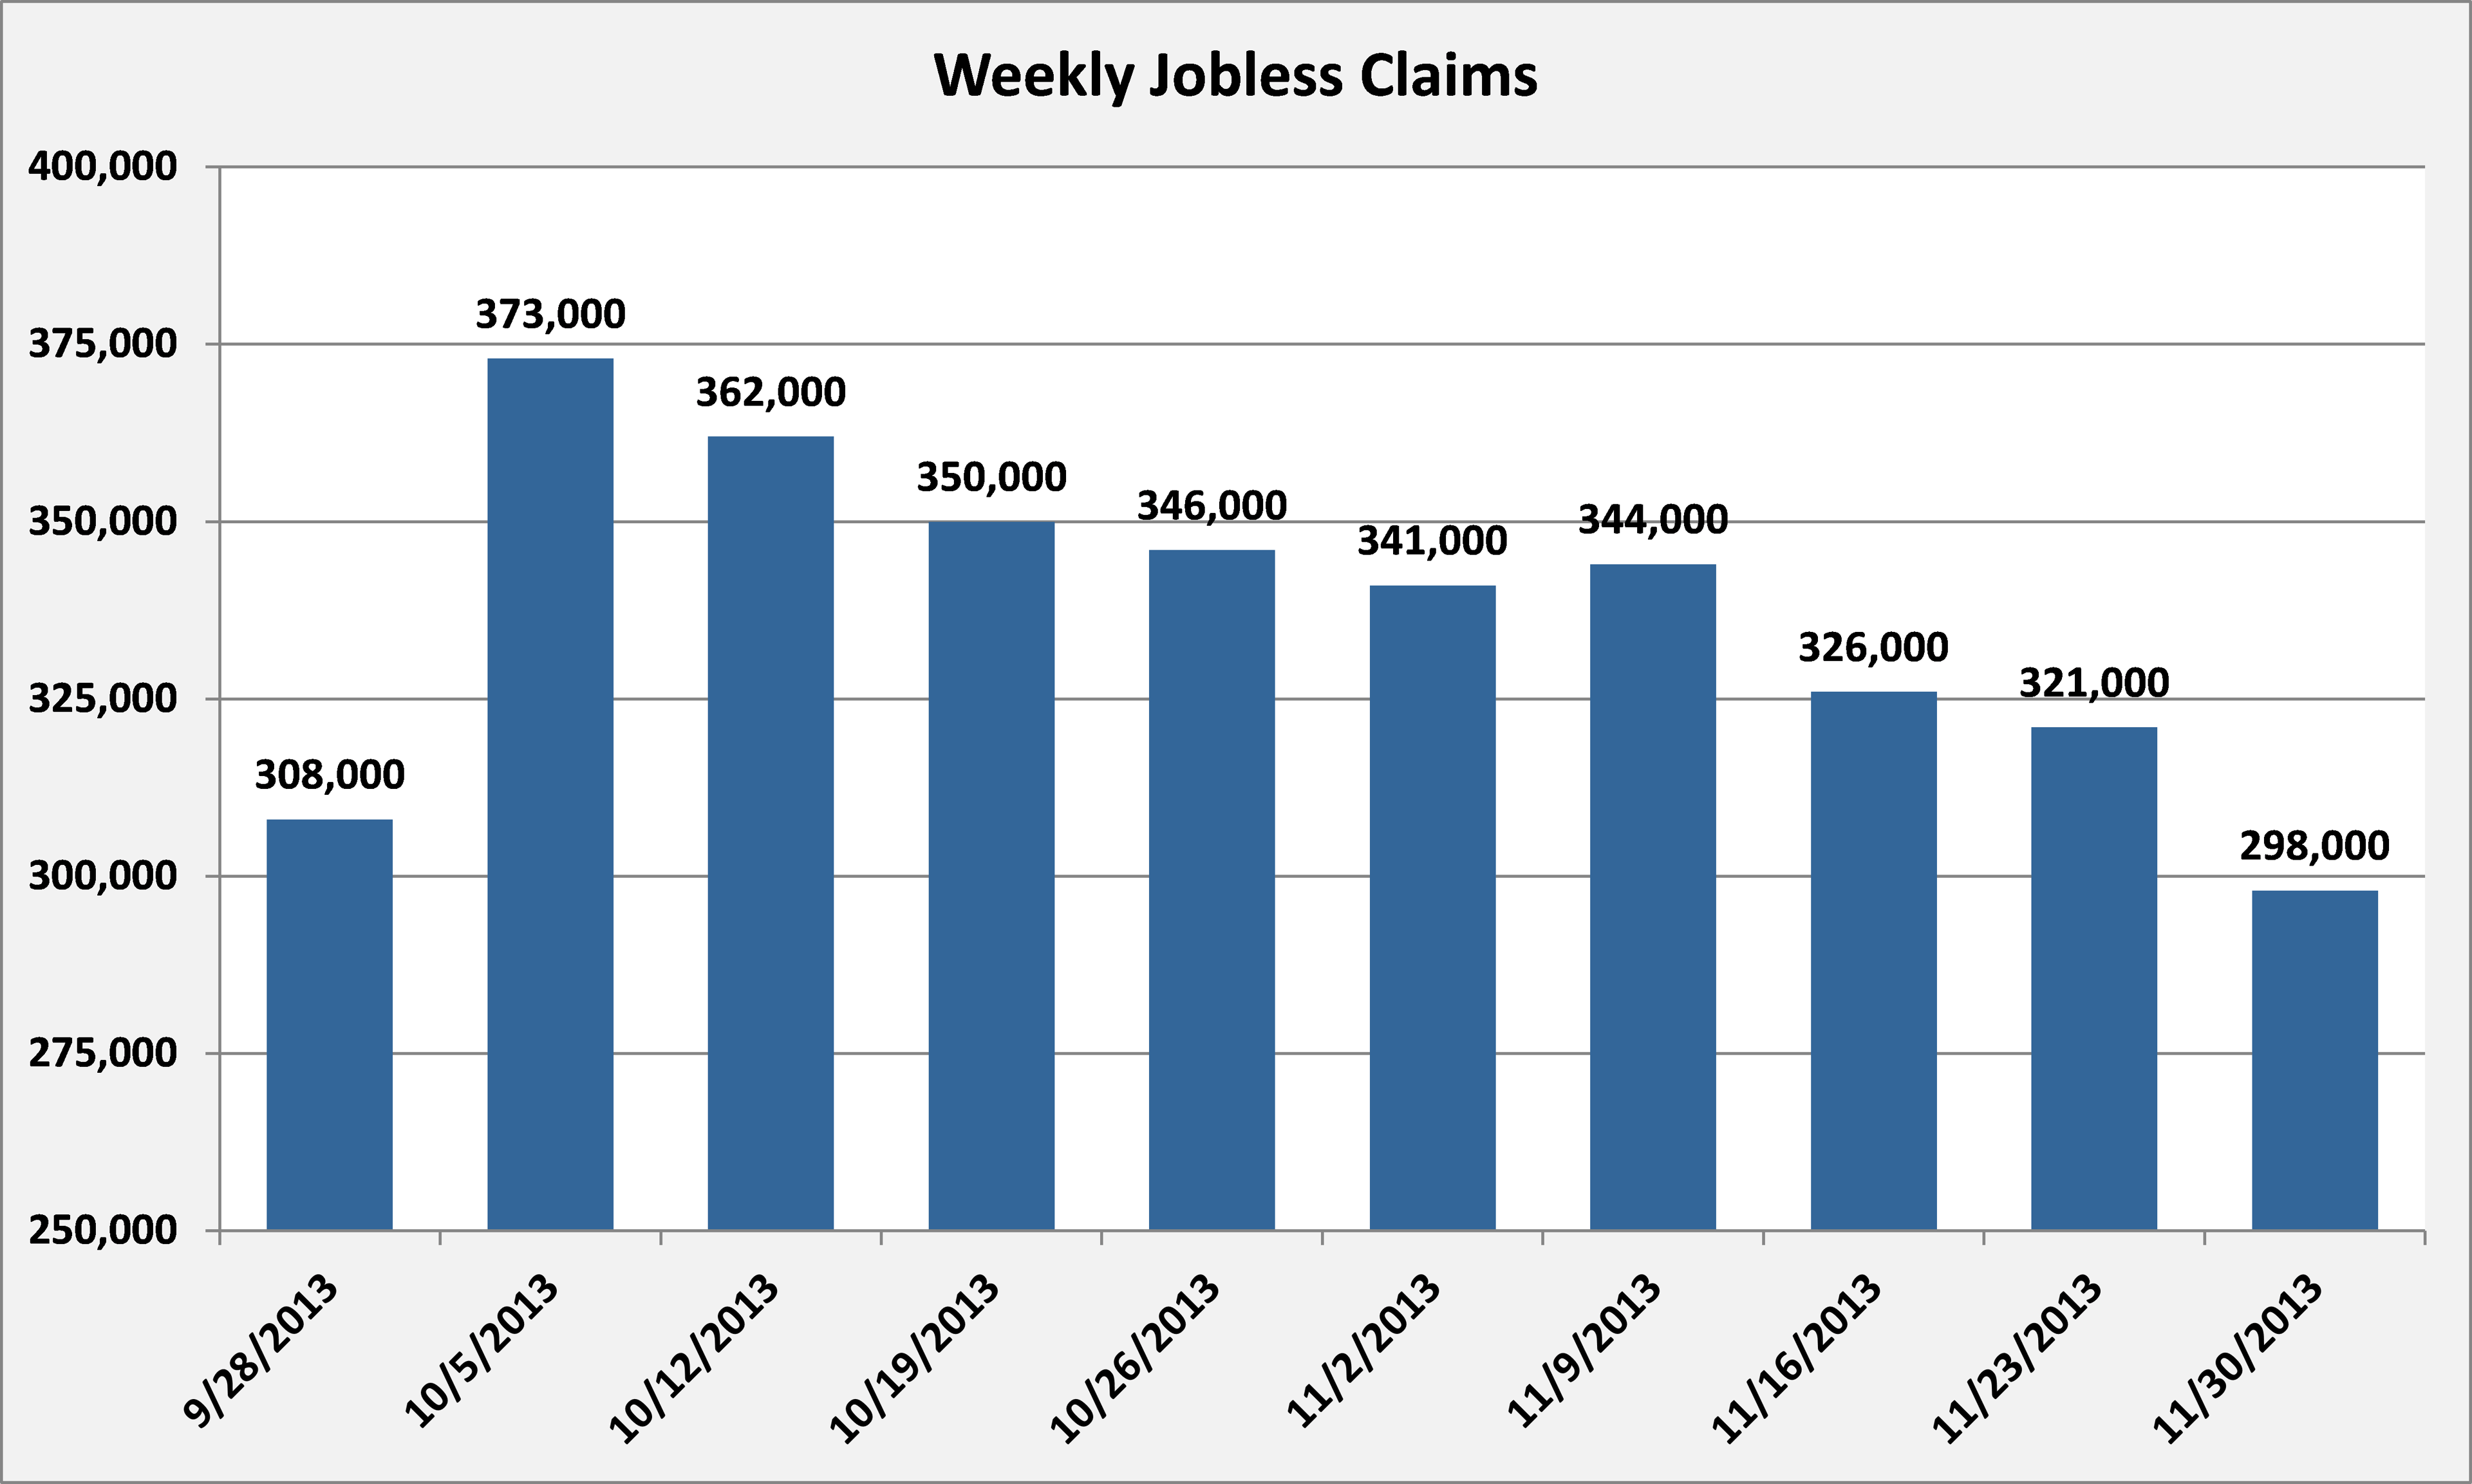
Source: U.S. Department of Labor.
The 298,000 claims was the lowest weekly amount since 294,000 were reported for the week ending Sept. 7 of this year, a week when the figures were pushed lower by computer issues. This was also only the second time since May 2007 when the weekly jobless claims were below 300,000. Jobless claims for the comparable weeks over the last five years are shown in the table below:
|
Week Ending |
Initial Claims |
|---|---|
|
12/5/2009 |
498,000 |
|
12/4/2010 |
431,000 |
|
12/3/2011 |
388,000 |
|
12/1/2012 |
370,000 |
|
11/30/2013 |
298,000 |
Source: U.S. Department of Labor.
As a result of the continued drop in jobless claims, the four-week-moving average fell from 333,000 to 322,250. This represented a decrease of approximately 3%, or 10,750:
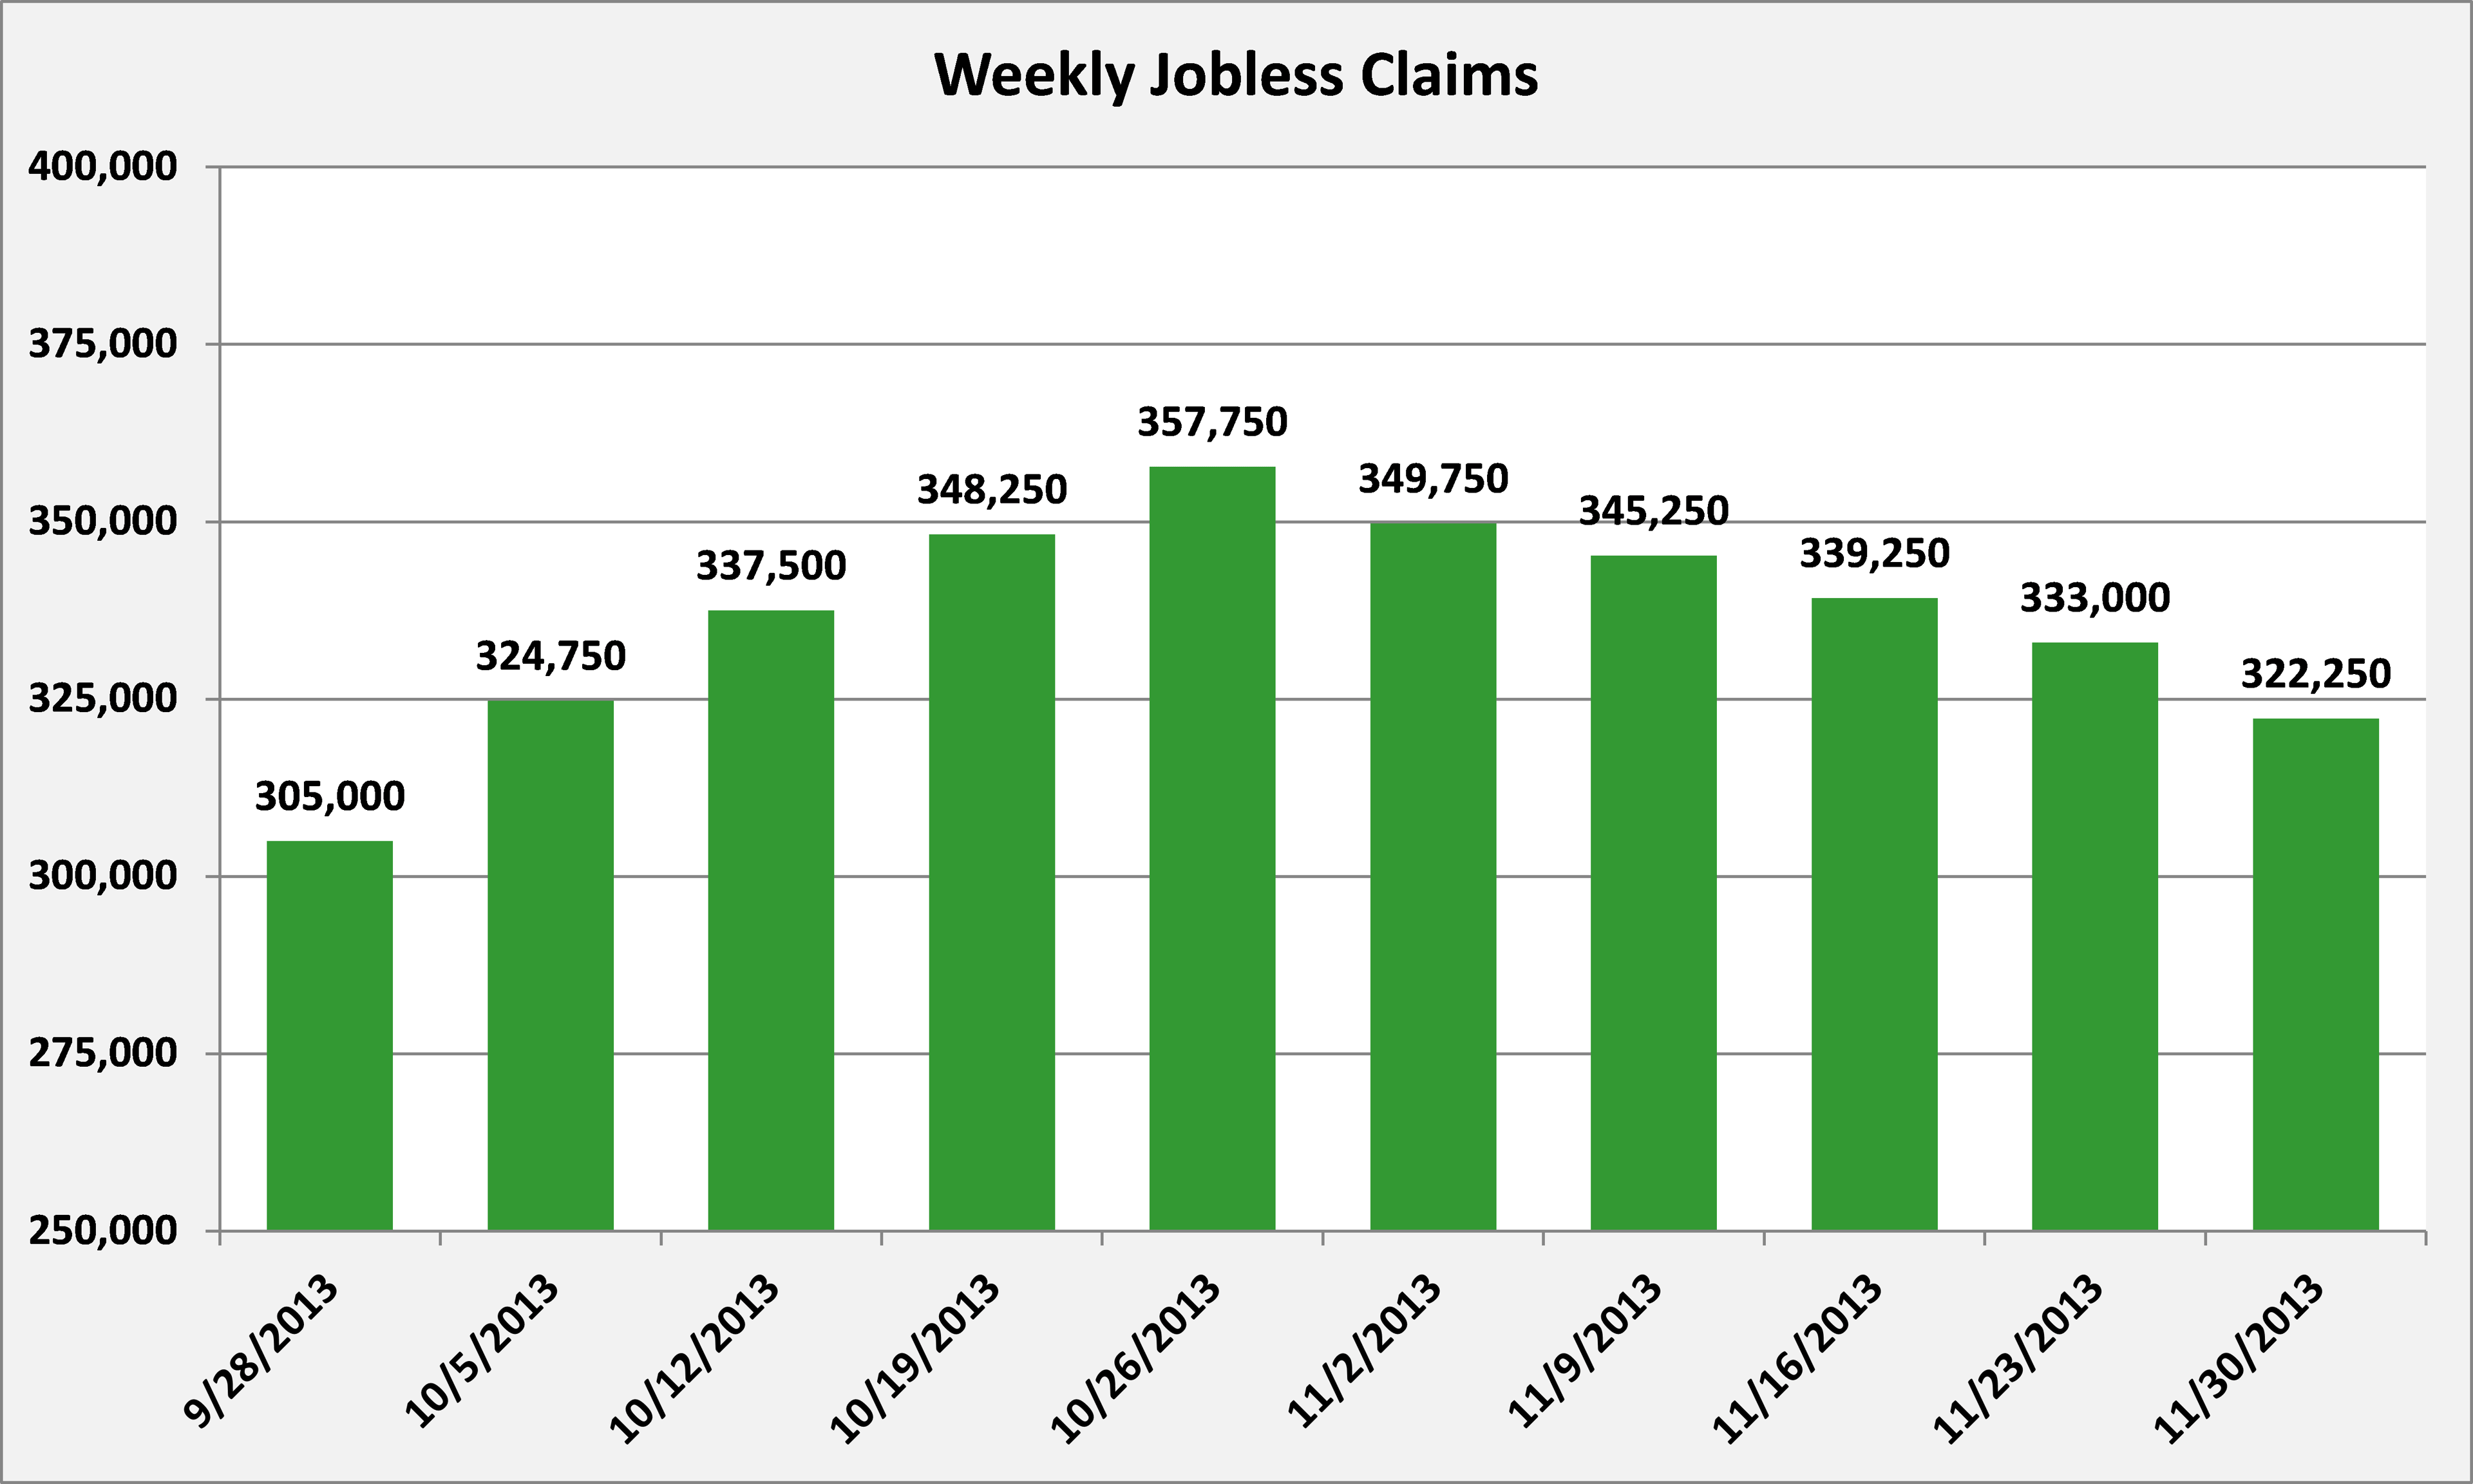
Source: U.S. Department of Labor. Four-week moving average.
The states with the biggest increases in claims for the week ending Nov. 23 (the most recent available data) were California, Pennsylvania, and Michigan, which saw their initial claims rise by 8,326, 4,416, and 3,426, respectively.
The total insured unemployment -- those receiving unemployment benefits -- also fell, from 2,765,000 to 2,744,000 for the week ending Nov. 23 (the most recent available data). In addition, the four-week average of those receiving unemployment benefits fell 32,500 to 2,796,500.

Source: U.S. Department of Labor.
The total number of individuals receiving unemployment insurance fell to the lowest level since Dec. 15, 2007. The insured unemployment rate remained stable at 2.1%.


