
Apple (AAPL 1.16%) stock touched new highs this week, reaching $109.32. Before the 7-to-1 split in June, $109.32 would have been $765.24. While that's only an 8.5% return (excluding dividends) since Apple touched a post-split $100 in 2012, it's a whopping 96% return from when shares pulled back to around $55 in the first half of 2013, a level that presented a no-brainer investment opportunity for those willing to go against the grain.

But what about the stock today? After soaring higher recently, is there still upside left for investors? Investors certainly shouldn't expect monstrous returns from here, but they also shouldn't automatically assume the stock is no longer a buy. Here are three simple reasons why Apple stock still looks tasty.
Apple's cash is still pouring in
Fiscal year 2014 was a good year for Apple. Financially, in fact, it was the company's best ever. Apple reported record revenue and EPS. And, importantly, the company is still growing its operating cash flow meaningfully, too. Operating cash flow was up 11%, handily outpacing revenue growth of 7%.
In absolute terms, net cash provided by operating activities amounted to a whopping $59.7 billion, or about 33% of Apple's total revenue. This sort of lucrative ratio of operating cash flow to revenue puts the tech giant on par with Google and Microsoft, software companies with business models that should, in theory, be well ahead of Apple on any measure of profitability. Google's operating cash flow-to-revenue is 31% Microsoft's is 35%.
Apple's consistently excellent operating cash flow is evidence of the company's pricing power and economies of scale -- two factors that make competing with Apple in hardware incredibly difficult.
Further, Apple's high levels of cash flow enable the company to spend meaningfully on building shareholder value through capital investments, share repurchases, and dividends.
Apple's valuation is conservative
Even Microsoft, with revenue growth seeming to plateau, trades at a premium to Apple when measured by most valuation metrics.

AAPL P/E Ratio (TTM) data by YCharts
Price-to-earnings and price-to-free cash flow both help show the premium that investors are placing on an underlying business' profitability. The lower these ratios, of course, the cheaper the stock. Apple, surprisingly, trades at a lower premium to earnings and free cash flow than Microsoft despite Apple's better EPS and revenue growth.
Apple's price-to-earnings ratio of 17 even sits below the S&P 500's P/E ratio of 18.7.
Good stewardship makes a difference
Not all cash cows are created equally. Stewardship plays a huge role in the shareholder value cash cows can create with their hefty levels of cash flow.
How does Apple measure up on stewardship? The company unquestionably earns an A+. Between a penny-pinching approach to acquisitions and an aggressive repurchase program, Apple has proven to investors that it doesn't take its capital allocation decisions lightly. And the company deserves huge bonus points for executing aggressively on a record share repurchase program when shares were dirt cheap.
The magnitude of Apple's share repurchase program since it started it in fiscal year 2013 cannot be understated. The best way to convey repurchases to date is with a chart of the company's share count.
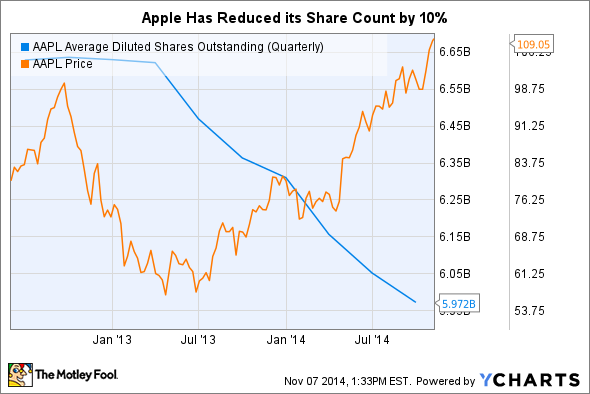
AAPL Average Diluted Shares Outstanding (Quarterly) data by YCharts
Of course, then there's Apple's dividend. While the yield is small today, at 1.7%, the company has said it intends to increase it on an annual basis. This gives long-term investors a small but meaningful stream of income they can expect to grow over the long haul.
The fact that Apple stock is trading at all-time highs doesn't mean it should be kicked to the curb. This cash cow still trades at a reasonable valuation in a pricey market.


