One of the ongoing concerns that FedEx Corporation (FDX +1.08%) investors have is its cash flow generation. In short, FedEx's free cash flow generation has consistently lagged that of rival United Parcel Service (UPS +1.02%).
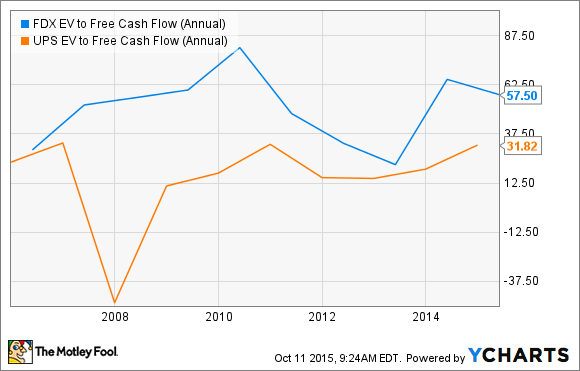
FDX EV to Free Cash Flow (Annual) data by YCharts
With this in mind, let's look at the facts and ask what's been going on with FedEx's cash flow generation. The key question being: does its history of weak free cash flow generation mean the stock should be avoided?
Changing trends
The business environment has changed somewhat for both companies in recent years, with three key trends having an effect on the structure of their businesses.
- Growth in global trade has been slower than global economic growth, pressuring both companies' international delivery growth.
- Customers are increasingly favoring slower, less expensive delivery options, meaning extra investment in ground networks.
- Increasing e-commerce demand has created stronger peak demand period during holiday seasons, and both companies have invested in capacity expansions and increased seasonal hiring.
As a consequence, UPS and FedEx have increased capital expenditures. Free cash flow is simply operational cash flow minus capital expenditures, so naturally free cash flow generation has come under pressure. Both companies have seen an upward trend in capital expenditures since 2010:
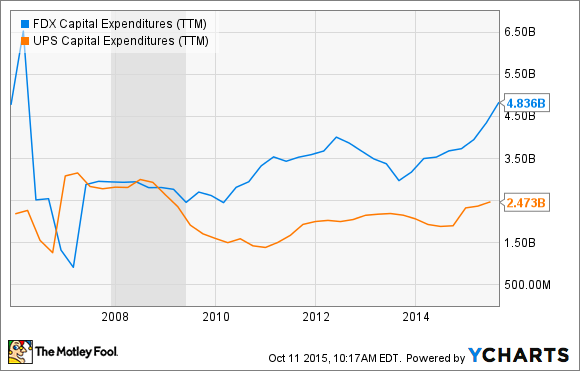
FDX Capital Expenditures (TTM) data by YCharts
FedEx's free cash flow generation
This is a particularly acute problem for FedEx, as its free-cash flow conversion has been consistently lower than UPS's. The following chart shows the past 10 years of conversion from sales for both companies.

Source: FedEx Corporation and United Parcel Service presentations. FedEx figures are to its latest year end in May 2015.
Given that industry trends are ongoing, does this mean FedEx is doomed to be a poor cash generator?
I have three arguments that should allay any fears.
Reasons to be cheerful
First, even though FedEx has been increasing CapEx to meet e-commerce demand, the majority of the increase in its capital expenditure has come from modernizing its fleet of aircraft at FedEx Express -- an investment that should produce cost savings in the future because of increased fuel efficiency.
The following chart breaks out FedEx's capital expenditures by asset category. Spending on facilities and sort equipment -- primarily for FedEx Ground -- increased markedly in fiscal 2015, but it's still significantly below spending on aircraft. In other words, FedEx's increased capital expenditures aren't just about capacity expansions to deal with peak.

Source: FedEx Corporation presentations. All figures in millions of U.S. dollars.
Second, many of the increased capital expenditures have come from growth initiatives intended to increase profitability in the future. The following chart breaks out FedEx's maintenance and growth capital expenditures and compares them with asset depreciation. As a rough guide, companies' maintenance spending should approximate to its depreciation. However, since it is normal for growth to occur, you can expect growth spending to take the ratio of total capital expenditures to depreciation to above 1 in the long term.
FedEx's growth spending has been significant in recent years, but maintenance spending is lower than depreciation. This situation implies that when FedEx comes out of growth mode, its overall capital expenditures could fall significantly.

Source: FedEx Corporation presentations. Figures in billions of U.S. dollars.
Third, management has been keen to stress that 2016 is likely to represent a peak in capital spending. On the latest earnings call, CFO Alan Graf reiterated his expectation that capital expenditures would total $4.6 billion in 2016, up around $250 million from the $4.3 billion spent in 2015. However, he outlined that it "will be our peak year for investment at Ground for the next several years."
Moreover, he said, you can expect capital expenditures to drop significantly after 2016: "My comment about capex dropping 30% to 35% is more a recognition that after this year, we will be in a more normal capital expenditure pattern."
Foolish takeaway
To put the final point into context, Graf is indicating that capital expenditures will be around $3.1 billion in 2017. FedEx's 10-year average operating cash flow conversion from revenue is around 10%, and assuming 2017 revenue is in line with analyst expectations for $52.42 billion, you can pencil in a figure of $2.14 billion for free cash flow generation in 2017 -- a figure significantly higher than the $1 billion generated in 2015.
In addition, $2.1 billion of free cash flow in 2017 would put FedEx on a forward enterprise value (market cap plus net debt)-to-free cash flow multiple of 22.7. As the first chart showed, this figure is a discount to UPS's current rating. Moreover, this figure assumes no extra cash flow conversion following the achievement of FedEx's profitability improvement program intended to increase profitability by $1.7 billion a year by the end of fiscal 2016. In fact, analysts predict that FedEx earnings will increase 36.5% from 2015 to 2017.
All told, FedEx's free cash flow generation hasn't been great in recent years, but it's likely to get a lot better in future years as it plays catch-up to UPS.