While we don't believe in macroeconomic speculation at the Motley Fool, we admit that sometimes key insights into a company's prospects can be explained by looking closely at an industry or macro economic indicator. After all, it's hard for even the best company to fight against strong economic tides. With that in mind, the information in the following 5 charts give a rough idea of how the underlying industries of the 5 companies in question might fare in the year ahead.
ISM Manufacturing
We'll start with the Institute for Supply Management, or ISM, purchasing managers index. It's one of the longest-running and most widely used U.S. manufacturing indicators. A reading above 50 indicates expansion. As you can see in the chart below, the manufacturing index has weakened in 2015, especially compared to the services index.
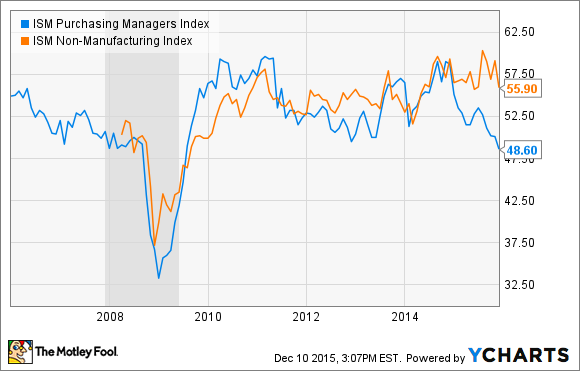
ISM Purchasing Managers Index data by YCharts.
This is bad news for industrial sector in general and particularly for industrial supply companies like Fastenal (FAST 0.60%). Selling industrial fasteners to the manufacturing industry is tough when activity is contracting. For example, Fastenal's daily sales growth in the year to November is down 1.6% to manufacturing customers. Any further weakening in the index in 2016 and Fastenal will surely suffer.
Baker Hughes rig count
The ISM indicator is useful as a broad indicator, but it doesn't specifically capture the weakness in heavy machinery capital spending -- an area of exposure for Fastenal.
One way to monitor oil capital spending, particularly in the upstream oil sector, is to look at Baker Hughes North American rotary rig count, a measure of the total active drilling rigs in North America, and the key indicator to follow for an oil services company like Halliburton (HAL +2.30%). As you can see, it tends to correlate with the price of crude oil.

U.S. Rotary Rigs data by YCharts.
Halliburton is exposed to upstream oil activity, and generates the majority of its operating income from North America. Meanwhile, Baker Hughes, a company Halliburton is intending to merge with, also tends to generate around half its revenue from North America.
Construction
However, it's not all doom and gloom in the industrial world, as the construction, automotive, and aerospace sectors have notably outperformed. The leading indicator to follow in U.S. construction is the Architectural Billings Index, or ABI, from the American Institute of Architects. A reading above 50 indicates expansion.
As you can see below, all of its subcomponents grew in the fall of 2015, with institutional in positive territory for the last 17 months, residential recovering from a correction in the first half of 2015. Commercial/Industrial has been more varied, but still positive in nine of the last 12 months.

IMAGE SOURCE: AMERICAN INSTITUTE OF ARCHITECTS.
All of which is good for a company like United Technologies (UTX 0.12%) which generates half its revenue from its Otis elevators and climate, controls, and security, (CCS) segments. Indeed, the company expects Otis' new equipment sales to be up 10% in the Americas in 2016, helping to offset high-single-digit declines in China. Total Otis sales are expected to be up low single-digits in 2016. Meanwhile, United Technologies expects its CCS sales to be up low single-digits, with global residential and commercial heating ventilation and air conditioning sales expected to rise mid single-digits.
Automotive and aerospace
Automotive and aerospace were the standout areas in the industrial sector during the last year. However, there are uncertainties over China's contribution to growth in both industries going forward. China produces roughly a quarter of the world's vehicles -- a market share that has more than doubled since 2007, and its production growth is key to a company like Johnson Controls (JCI +0.03%). The company intends to spinoff its automotive experience segment (car interiors and seating) in 2016 and conditions in China are key to a successful execution.
As you can see in the following chart, China's passenger car sales growth has bounced back strongly in late 2015 following a tax break in October. Moreover, Johnson Controls expects Chinese automotive production to increase nearly 11% in 2016. Will China's auto sales bounce back be short-lived?

DATA SOURCE: CHINA ASSOCIATION OF AUTOMOBILE MANUFACTURERS.
Finally, one sector of the industrial economy has seen upgrades to expectations from its leading body. The International Air Transport Association recently upgraded its forecast for worldwide airline profitability in 2015, which is usually good news for Boeing Company (BA +0.01%) investors. It now expects $33 billion compared to a previous estimate for $29.6 billion.
Airline profits are expected to continue growing strongly in 2016, and that should by good news for Boeing's attempts to generate new commercial aircraft orders -- particularly at a time when low oil prices are reducing demand for newer more energy efficient aircraft -- and for United Technologies' aerospace businesses.

IMAGE SOURCE: INTERNATIONAL AIR TRAFFIC ASSOCIATION.
All told, the industrial sector has seen mixed performance in 2015 and it looks likely to continue in 2016. It's hard to tell where energy prices are headed, or the sustainability of China's recent auto sales boost, but North American construction prospects look good, while global aerospace appears to be holding up well.