
The biggest story in investing is understanding why so many people have been hurt by, and are skeptical of, a market that has increased 18,500-fold in the last century.
Financial advisor Carl Richards dubbed what he calls "the behavior gap," which is the difference between what the market returns and what the average investor earns. It's caused by people's tendency to chase returns at the top only to get scared out at the bottom.
There's another gap that helps explain why generous markets are full of skeptics. I call it the pain gap.
The pain gap is the difference between what the market returns in a year and what it did during that year.
Here's one way to think of it: Since 1925 the S&P 500 has returned about 10% a year. But the average difference between a year's highest and lowest close is more than triple that amount, 31.6%.
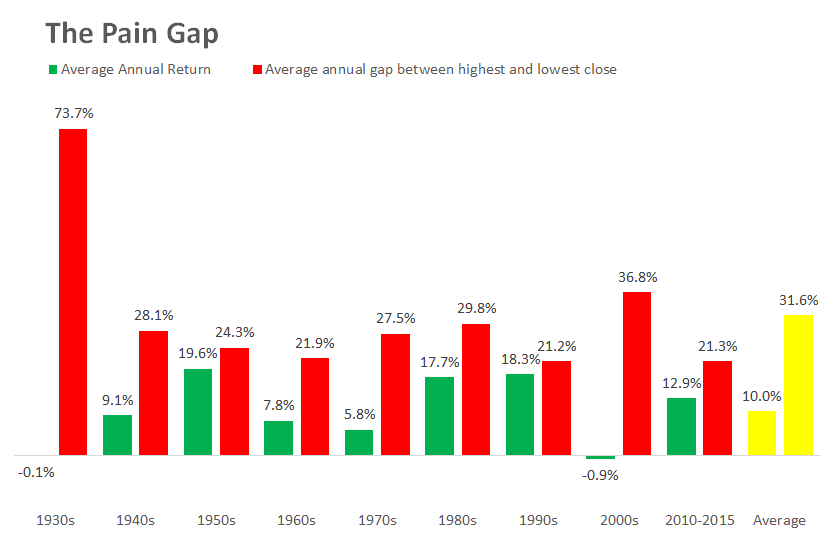
This is just a different way to think about volatility. But volatility is one of the hardest things for investors to contextualize. It's one thing to tell investors that bear markets are normal, or to be prepared for a pullback. It's another to wrap your head around the idea that even during the best years, there can be a huge gap between what the market gained and what it did.
Take 1998. It's glorified as part of the late 1990s stock boom where markets went one way – up. Sure enough, the S&P soared 28% in 1998, one of the biggest gains of all time.
But 1998 was actually a vicious nightmare for most investors. It started with a 20% surge by July, then gave everything back and was down for the year by October, only to log one of the best quarters in history to finish the year up 28%.
In isolation 1998 is the kind of year investors dream about, and financial marketers use to show how lucrative investing can be. But actually living through 1998 meant waking up every morning wondering what the hell was going on, not knowing if the next 90 days meant you'd make or lose a third of your life savings. That's the pain gap.
It's the same in every bull market.
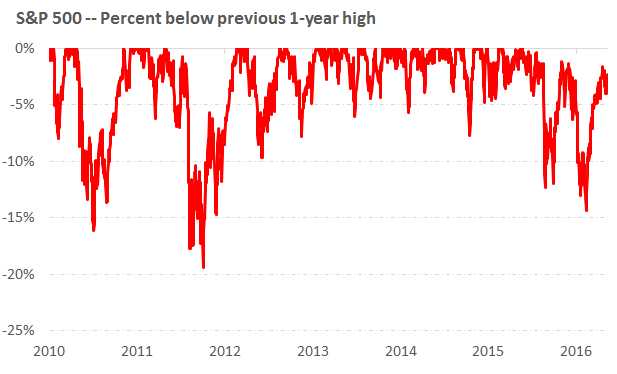
The easy narrative of the last seven years is that stocks have gone straight up, which is what it looks like if you zoom out far enough. The S&P 500 is up 164% since 2009, and has increased in each of the last seven years.
But the last seven years have actually been pretty nuts. The market has been below its previous one-year high on 87% of days since 2010, and more than 10% below its previous high on about 11% of all days:
The pain gap shows up everywhere, even during declines.
A lost decade doesn't mean you go 10 years without making any money. It means you make and lose several fortunes, each successive one tearing away at your faith and patience.
A bear market doesn't just mean stocks go down. It means they frequently have huge rallies amid the backdrop of decline, offering hope and optimism every few weeks that's snatched away just as fast.
The pain gap helps explain why the behavior gap exists. Markets look phenomenal and rewarding when you zoom out, because they are. But people don't live zoomed out. They live day to day, month to month, brokerage statement to brokerage statement, where even the best of times come with the constant sting of reminding you that markets owe you nothing without requiring patience and endurance in return.
For more:
Why does pessimism sound so smart?
