Microsoft (MSFT -2.40%) is one of the world’s largest and most influential technology companies, with businesses spanning productivity software, cloud computing, and consumer devices. Best known for products like Windows, Office, and Xbox, Microsoft also runs a fast-growing cloud platform (Azure) and owns LinkedIn.
In recent years, the company has doubled down on long-term growth drivers, including artificial intelligence and gaming. Its multibillion-dollar partnership with OpenAI is reshaping products across Office, Azure, and Bing, while the acquisition of Activision Blizzard strengthened its Xbox ecosystem. Strong cash flow from its core businesses allows Microsoft to invest aggressively while still returning capital to shareholders.
Here’s what to know about buying Microsoft stock and whether it belongs in your portfolio.
How to buy Microsoft stock
Here's a step-by-step guide to buying Microsoft stock.
- Open your brokerage account: Log in to your brokerage account where you handle your investments. If you still need to open one, these are some of the best-rated brokers and trading platforms.
- Search for Microsoft: Enter the ticker "MSFT" into the search bar to bring up the stock's trading page.
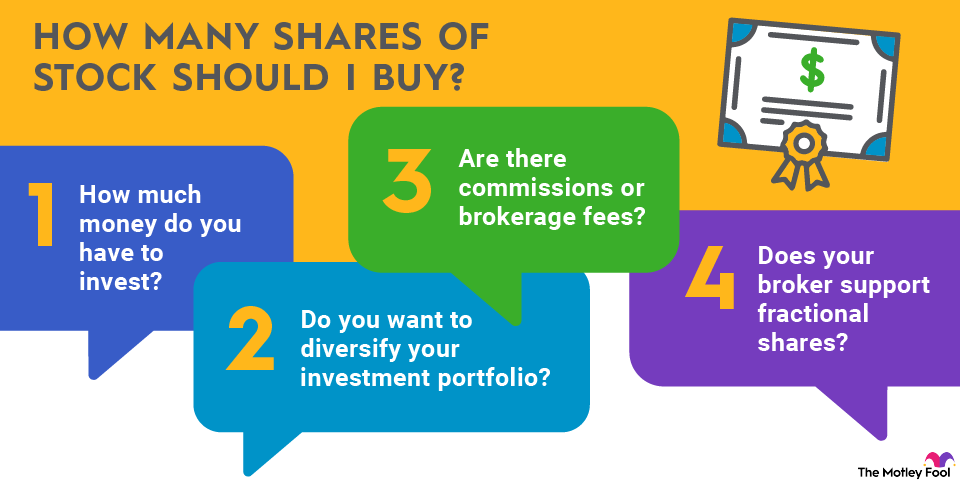
- Decide how many shares to buy: Consider your investment goals and how much of your portfolio you want to allocate to this stock.
- Select order type: Choose between a market order to buy at the current price or a limit order to specify the maximum price you're willing to pay.
- Submit your order: Confirm the details and submit your buy order.
- Review your purchase: Check your portfolio to ensure your order was filled as expected and adjust your investment strategy accordingly.
Once you complete the order page, click the Place Order button at the bottom and become a Microsoft shareholder.
About Microsoft
Microsoft operates one of the most diversified technology platforms in the world. Its business is organized into three main segments:
- Productivity and Business Processes: Includes Office, Microsoft 365, LinkedIn, and enterprise productivity tools.
- Intelligent Cloud: Anchored by Azure, along with server products and cloud services used by businesses worldwide.
- More Personal Computing: Covers Windows, Xbox, Bing, and Surface devices.
This mix gives Microsoft multiple growth engines and steady recurring revenue from both consumers and enterprises.
In recent years, Microsoft has made major investments to strengthen its long-term position. The company completed its acquisition of Activision Blizzard to expand its gaming ecosystem and committed billions to OpenAI, integrating AI across Office, Azure, and search. These moves position Microsoft at the center of enterprise software, cloud infrastructure, and artificial intelligence.
Strong cash flow from its core businesses allows Microsoft to fund innovation, pursue acquisitions, and return capital to shareholders through dividends and buybacks.
Should you invest in Microsoft?
Here are some reasons you might want to consider buying Microsoft stock:
- You want to own a small piece of one of the world's largest technology titans.
- You understand how Microsoft makes money.
- You want to own individual stocks.
- You've thoroughly researched Microsoft and plan to continue following the company.
- You think Microsoft can continue growing its profits at an above-average pace.
- You want to invest in one of the most financially robust companies in the world.
- You think the Activision deal will help grow Microsoft's Xbox platform.
- You believe the company's investment in OpenAI will give it a competitive edge in the AI age.
- You don't need a lot of dividend income right now, but you believe Microsoft will continue increasing its payout at a healthy pace in the years to come.
- You believe Microsoft can outperform the S&P 500 over the long term.
- You use Microsoft's products and want to invest in the company that makes them.
- You understand the risks of investing in Microsoft, including that its shares could lose value.
Here are some reasons to be cautious about investing in Microsoft:
- You're concerned about AI and unsure whether Microsoft's investment in OpenAI will create shareholder value.
- You don't like big tech companies and worry they're becoming too powerful.
- You're unsure whether Microsoft's acquisition of Activision will create value for shareholders.
- You need a higher-yielding dividend than Microsoft currently offers.
- You're unsure whether Microsoft can beat the S&P 500 over the long term.
- You don't want to own shares in a company founded by Bill Gates.
- You don't like Microsoft's products.
- You're younger and want to invest in a company earlier in its growth cycle than Microsoft, which has been around for almost a half-century.

NASDAQ: MSFT
Key Data Points
Is Microsoft profitable?
Profit growth helps drive stock price appreciation over the longer term. It's an ideal area for beginning investors to focus on before buying shares of any company.
Microsoft is enormously profitable. The technology giant generated $281.7 billion of revenue in its 2025 fiscal year (up 15%) and $128.5 billion in operating income (up 17%). The company has increased its earnings sharply over the years, helping drive strong stock price appreciation:

Microsoft's Azure program was a notable growth driver with 34% revenue growth in its fiscal fourth quarter. And the company sees more growth ahead. It expects its revenue and earnings to be higher in its 2025 fiscal year, driven in part by its ability to capitalize on AI.
Does Microsoft pay a dividend?
Microsoft started paying a dividend in 2003. However, it doesn't have a high dividend yield compared to other stocks. (Microsoft's yield was less than 0.8% in late 2025 compared to below 1.5% for the S&P 500.)
Microsoft held the title of world's top dividend payer in 2023, paying out more than $20 billion in cash to its shareholders. The company has steadily increased its payout over the years, notching its 14th consecutive year of increasing the dividend in 2023, when it boosted the payout by 10%.
Microsoft is among the biggest dividend payers in the country.
How to invest in Microsoft through ETFs
Instead of actively buying shares of Microsoft directly, you can passively invest in the technology company through a fund holding its shares. Microsoft is one of the largest traded companies by market capitalization and is a widely held stock.
Microsoft is in several stock market indexes, including the Dow Jones Industrial Average and S&P 500 Index. As a result, index funds and exchange-traded funds (ETFs) that benchmark their returns against those indexes hold Microsoft stock. According to ETF.com, 723 ETFs held 1.1 billion shares of Microsoft as of late 2025. The ETFs with the most shares were:
Exchange-Traded Fund | Assets Under Management | Microsoft Shares Held | Fund Weighting | Position Ranking in Fund |
|---|---|---|---|---|
SPDR S&P 500 ETF Trust (NYSEMKT:SPY) | $691.46 billion | 89.18 million | 6.12% | Second-largest |
Invesco QQQ Trust (NASDAQ:QQQ) | $398.26 billion | 63.64 million | 7.69% | Third-largest |
iShares Core S&P 500 (NYSEMKT:IVV) | $723.96 billion | 81.7 million | 6.5% | Third-largest |
Vanguard S&P 500 ETF (NYSEMKT:VOO) | $499.3 billion | 93.02 million | 6.7% | Third-largest |
Vanguard Total Stock Market ETF (NYSEMKT:VTI) | $560.06 billion | 233.31 million | 5.88% | Third-largest |
As one of the world's largest companies by market cap, Microsoft carries a meaningful portfolio weighting in the biggest ETFs. Among the biggest ETFs, the Invesco QQQ Trust (QQQ -1.07%) has the largest portfolio weighting to Microsoft, making it a potential option for investors seeking to gain exposure to Microsoft through a passive ETF investment.
Another relatively large ETF with an even greater portfolio weighting of Microsoft stock is the Technology Select Sector SPDR Fund (XLK -1.28%). Microsoft has a roughly 11.64% portfolio weighting in the fund, providing another possible way to gain meaningful exposure to Microsoft through a passive ETF investment.
Will Microsoft stock split?
As of late 2025, Microsoft had yet to announce an upcoming stock split. However, the company has completed several stock splits over the years:
Split Date | Stock Split |
|---|---|
February 2003 | 2-for-1 |
March 1999 | 2-for-1 |
February 1998 | 2-for-1 |
December 1996 | 2-for-1 |
May 1994 | 2-for-1 |
June 1992 | 3-for-2 |
June 1991 | 3-for-2 |
April 1990 | 2-for-1 |
September 1987 | 2-for-1 |
Microsoft had historically split its shares when they topped $100. However, the company has let its shares rise well past that level over the last two decades without a split (shares were over $480 in late 2025). Although that makes it seem like Microsoft could split its stock at any time, the company might let shares continue to rise without another split.
The bottom line
Microsoft is a technology titan. The company has developed many of the productivity products we use every day. It continues to invest in developing innovative products to drive profit growth, so it could continue to be a winning stock for long-term investors.
However, that doesn't mean Microsoft stock is for everyone. Each investor must carefully consider whether it belongs in their portfolio.
Related investing topics
FAQ
About the Author