Accessibility Menu
Forum Energy Technologies logo

Forum Energy Technologies

(NYSE) FET

Current Price$52.09
Market Cap$592.80MMarket cap calculated using publicly traded shares outstanding only. Does not include unlisted, private, or dual-class non-traded shares. Implied market cap may vary.
Since IPO (2012)-88%
5 Year+142%
1 Year+167%
1 Month+3%
Forum Energy Technologies last closing stock price
MetricPriceDate
Last closeUSD 52.442026-07-17
Forum Energy Technologies stock price return by period
PeriodPrice returnPrice at period startPeriod start date
1 week+5.58%USD 49.672026-07-10
1 month+3.33%USD 50.752026-06-17
3 month-6.51%USD 56.092026-04-17
Year to date+41.92%USD 36.952025-12-31
1 year+166.6%USD 19.672025-07-17
3 year+103.18%USD 25.812023-07-18
5 year+141.77%USD 21.692021-07-16
Since inception-87.94%USD 435.002012-04-12

Forum Energy Technologies Financials at a Glance

Market Cap

$592.80MMarket cap calculated using publicly traded shares outstanding only. Does not include unlisted, private, or dual-class non-traded shares. Implied market cap may vary.

Revenue (TTM)

$806.90M

Net Income (TTM)

-$6.29M

EPS (TTM)

-$0.59

P/E Ratio

-89.06

Dividend

$0.00

Beta (Volatility)

0.83 (Low)

Price

$52.09

Volume

964

Open

$51.60

Previous Close

$52.09

Daily Range

$51.60 - $52.78

52-Week Range

$18.12 - $65.43

Estimated Earnings Date

Jul 30, 2026

FET: Motley Fool Moneyball Superscore

59

Our CEO Is Handing Members His Secret Weapon

It's called Motley Fool Moneyball, our new proprietary AI tool

We spent over half a million dollars in R&D to build a tool that makes stock research faster, sharper, and smarter. Our analysts use it every day, and now, you can too.

Get Access Now

About Forum Energy Technologies

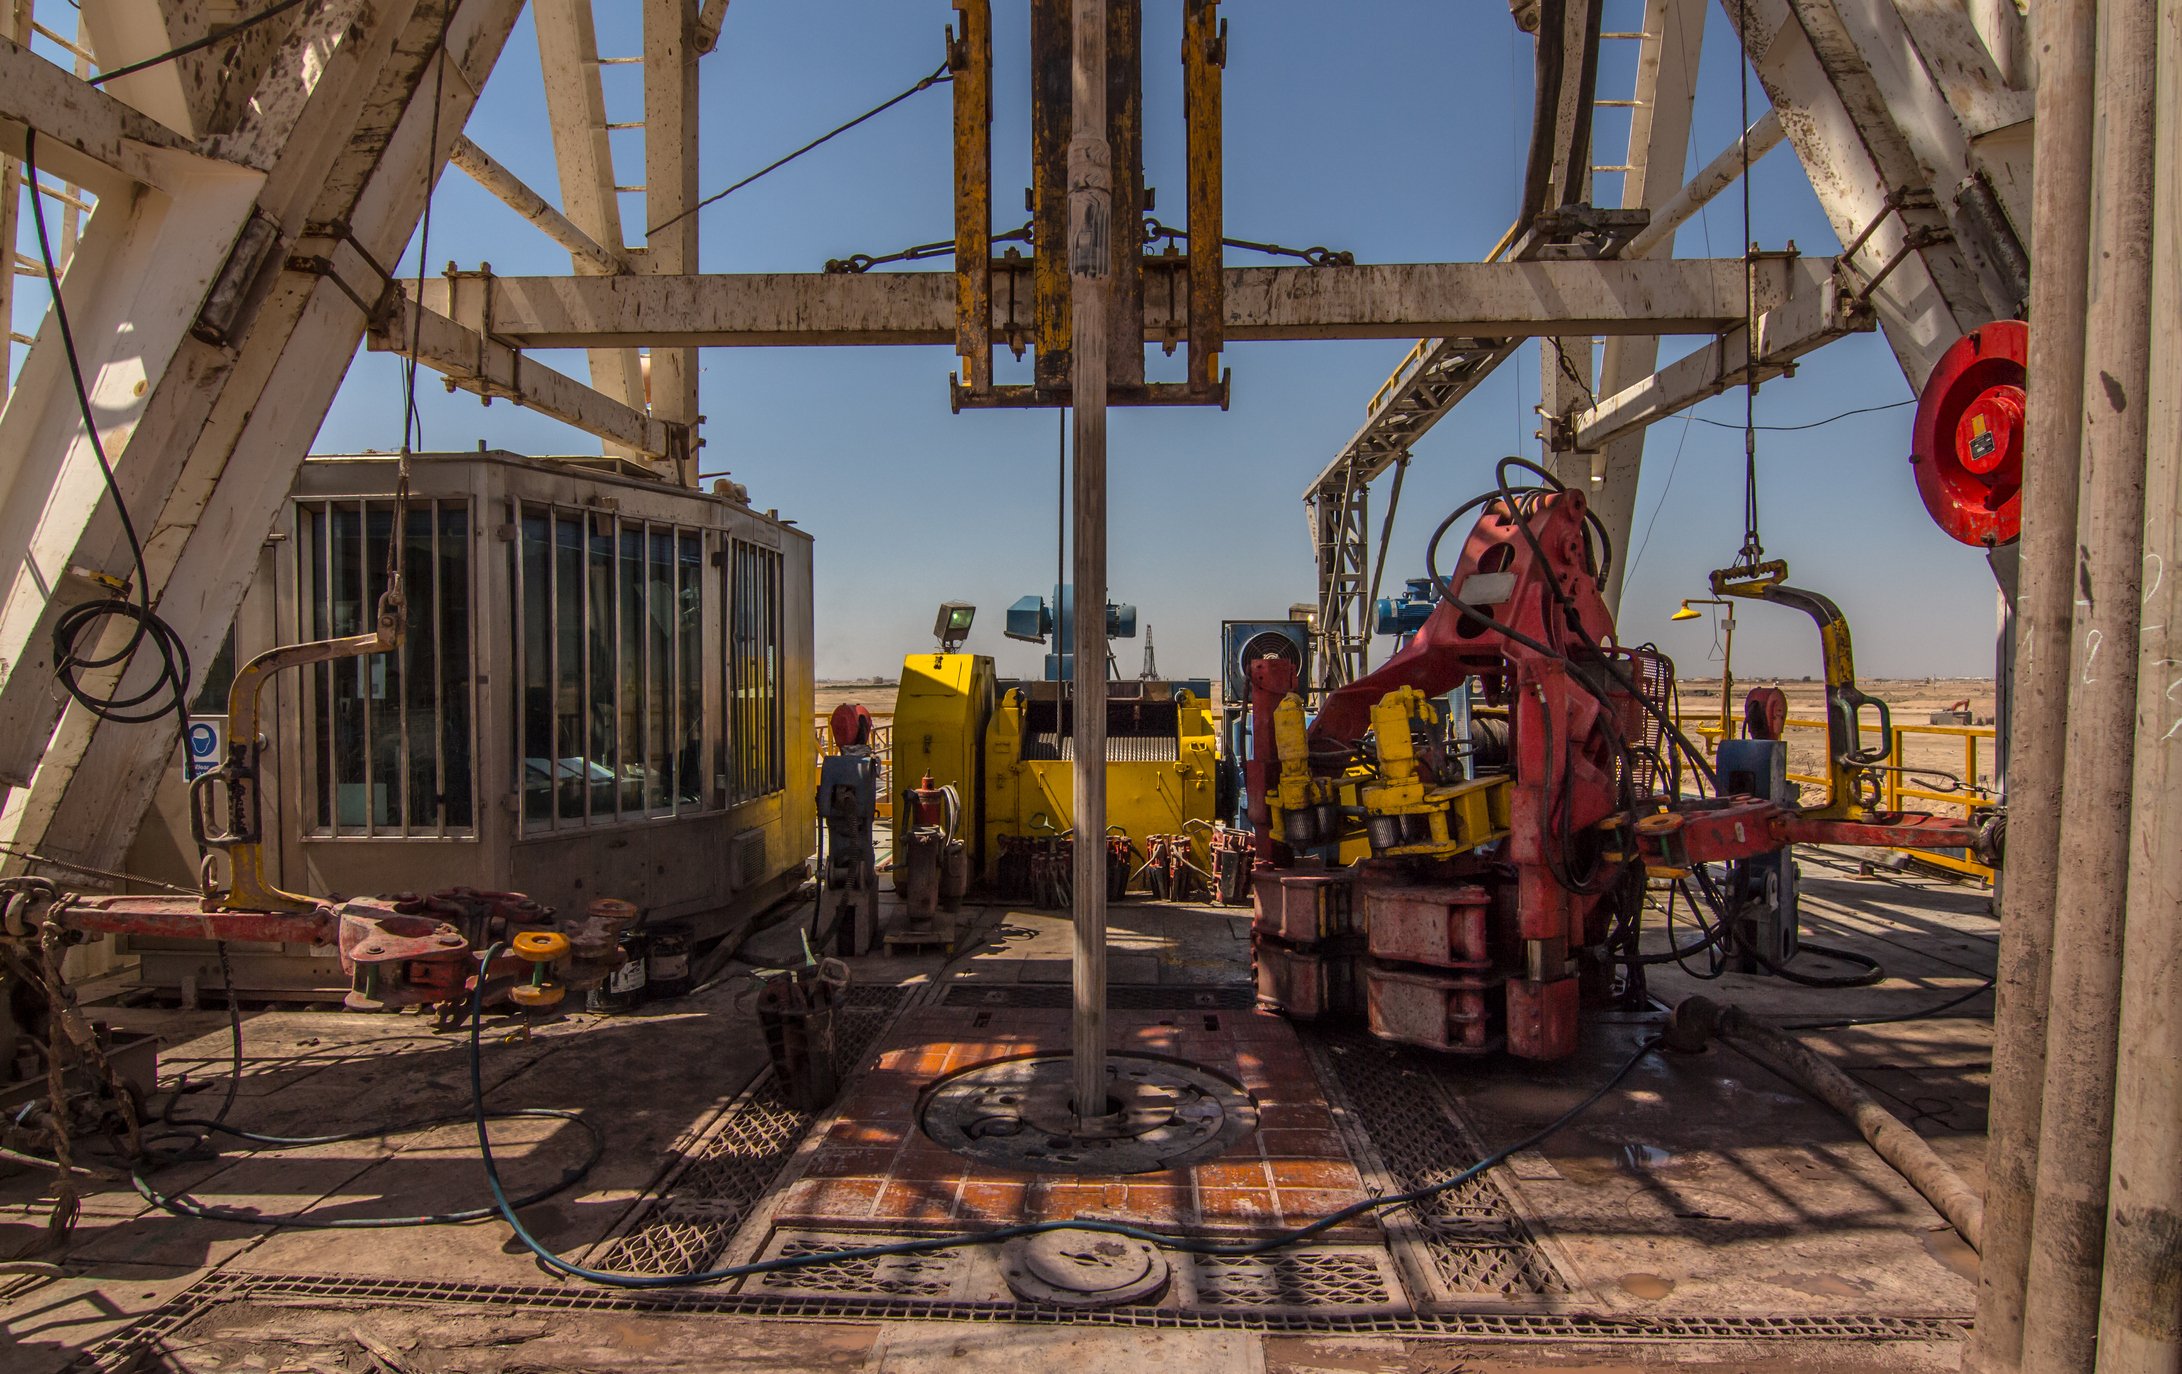
Forum makes tools for energy companies to drill for oil and gas. It helps workers stay safe and work more efficiently. Its equipment also serves the defense and renewable energy sectors.

Essential Tools for Energy Workers

  • Drilling and Completions: Underwater robots and high-pressure pumps; accounted for 60.7% of revenue in Q1 2026.
  • Artificial Lift and Downhole: Well casing, cementing, and flow control products; represented 39.3% of revenue in Q1 2026.
  • Subsea Technologies: Remote robots and trenchers for underwater construction and submarine rescue missions.
  • Valve Solutions: Industrial valves used in oil, gas, and power generation facilities.

Strategic Growth and Debt Extension

  • Amended the Credit Facility in February 2026 to extend the maturity date to February 2031.
  • Consolidated manufacturing facilities during Q1 2026 to reduce operating costs and improve efficiency.
  • Repurchased approximately 1.8 million shares of common stock between November 2021 and March 2026.
  • Discontinued specific product lines in 2026 to focus resources on more profitable technologies.

Steady Demand for Consumables

Forum relies heavily on activity-based products, which provided 75% of revenue in the first quarter of 2026. These consumable items require regular replacement, creating a steadier income stream than large equipment sales.

Recent Financial Trajectory

  • Revenue reached $208.7 million in Q1 2026, up 8% year-over-year.
  • Net income was $4.5 million in Q1 2026, up 300.4% from $1.1 million in Q1 2025.
  • Operating income hit $11 million in Q1 2026, up 25% from the previous year.
  • Free cash flow reached $20.9 million for the fourth quarter of 2025.

The Verdict

Forum has transitioned toward a business model focused on recurring revenue from consumable parts and specialized underwater robotics. Its recent efforts to extend debt and consolidate operations aim to stabilize its long-term financial position.

AI Generated • May 4, 2026

Industry

Energy Equipment and Services

Sector

Energy

Employees

1,700

CEO

Neal A. Lux

Headquarters

Houston, TX 77064, US

FET Financials

Key Financial Metrics (TTM)

Gross Margin

27.47%

Operating Margin

2.64%

Net Income Margin

-0.78%

Return on Equity

-2.09%

Return on Capital

3.74%

Return on Assets

-0.82%

Earnings Yield

-1.12%

Dividend Yield

0.00%

Payout Ratio

0.00%

Stock Overview

Market Cap

$592.80MMarket cap calculated using publicly traded shares outstanding only. Does not include unlisted, private, or dual-class non-traded shares. Implied market cap may vary.

Shares Outstanding

11.30M

Volume

964

Avg. Volume

165.62K

Financials (TTM)

Gross Profit

$221.67M

Operating Income

$21.31M

EBITDA

$79.21M

Operating Cash Flow

$62.73M

Capital Expenditure

-$1.69M

Free Cash Flow

$61.04M

Cash & ST Invst.

$37.49M

Total Debt

$240.20M

Forum Energy Technologies Performance Analysis

Forum Energy Technologies annual revenue and year-over-year revenue growth by fiscal year
Fiscal yearPeriod endRevenueYoY growth
20222022-12-31USD 699,913,00029.4%
20232023-12-31USD 738,864,0005.6%
20242024-12-31USD 816,425,00010.5%
20252025-12-31USD 791,474,000-3.1%
Forum Energy Technologies sequential (quarter-over-quarter) revenue growth by fiscal quarter
Fiscal quarterPeriod endQoQ growth
Q22025-06-303.4%
Q32025-09-30-1.8%
Q42025-12-313.0%
Q12026-03-313.2%
Forum Energy Technologies annual diluted earnings per share and year-over-year EPS growth by fiscal year
Fiscal yearPeriod endDiluted EPSYoY growth
20222022-12-31USD 0.62N/A
20232023-12-31USD -1.85N/A
20242024-12-31USD -11.00495.3%
20252025-12-31USD -0.81-92.6%
Forum Energy Technologies sequential (quarter-over-quarter) diluted earnings per share growth by fiscal quarter
Fiscal quarterPeriod endQoQ growth
Q22025-06-30583.1%
Q32025-09-30-373.8%
Q42025-12-31110.2%
Q12026-03-31129.4%

Revenue Growth Rate

Annual and quarterly growth comparison

Earnings Per Share Growth Rate

Annual and quarterly EPS growth comparison

Quarterly Performance

Name
Q1 2026YOY CHG

Revenue

$208.70M

+8.0%

Gross Profit

$60.99M

+4.5%

Gross Margin

29.22%

N/A

Market Cap

$592.80MMarket cap calculated using publicly traded shares outstanding only. Does not include unlisted, private, or dual-class non-traded shares. Implied market cap may vary.

N/A

Market Cap/Employee

$348.70K

N/A

Employees

1,700

N/A

Net Income

$4.49M

+300.4%

EBITDA

$19.33M

+2.4%

Quarterly Fundamentals

Name
Q1 2026YOY CHG

Total Cash

$37.49M

+20.4%

Total Debt

$240.20M

-0.8%

Accounts Receivable

$168.51M

+1.8%

Inventory

$236.41M

-10.3%

Long Term Debt

$238.81M

-0.6%

Short Term Debt

$1.38M

-24.4%

Return on Assets

-0.82%

N/A

Return on Invested Capital

3.84%

N/A

Free Cash Flow

$2.46M

-65.9%

Operating Cash Flow

$1.63M

-82.6%

Other Investments to Explore

People Also Watch

Symbol / CompanyPricePrice Chg
WTIW&T Offshore, Inc.
$3.49+4.80%
GPRKGeoPark Limited
$9.68+1.68%
OISOil States International, Inc.
$8.43-0.35%
NGSNatural Gas Services Group, Inc.
$38.77-2.12%

Trending Stocks

Symbol / CompanyPricePrice Chg
ONDSOndas
$6.53-0.02%
AALAmerican Airlines Group
$14.98-0.04%
INTCIntel
$95.04-0.02%
NOKNokia
$10.12-0.03%

Questions About FET

What is the current price of Forum Energy Technologies?

Forum Energy Technologies is trading at $52.09 per share.

What is the 52-week range for Forum Energy Technologies?

Over the past 52 weeks, Forum Energy Technologies has traded between $18.12 and $65.43.

How much debt does Forum Energy Technologies have?

As of the most recent reporting period, Forum Energy Technologies reported total debt of $240.20M.

How much cash does Forum Energy Technologies have on hand?

Forum Energy Technologies reported $37.49M in cash and cash equivalents in its most recent financial results.

What is Forum Energy Technologies’s dividend yield?

Forum Energy Technologies does not currently have a dividend yield.

Premium Investing Services

Invest better with The Motley Fool. Get stock recommendations, portfolio guidance, and more from The Motley Fool's premium services.