
Netflix
(NASDAQ) NFLX
Netflix Financials at a Glance
Market Cap
$387.68B
Revenue (TTM)
$45.18B
Net Income (TTM)
$10.98B
EPS (TTM)
$2.53
P/E Ratio
36.33
Dividend
$0.00
Beta (Volatility)
1.27 (Average)
Dividend
$0.00
Beta (Volatility)
1.27 (Average)
Price
$91.87
Volume
1,479,498
Open
$91.31
Price
$91.87
Volume
1,479,498
Open
$91.31
Previous Close
$91.87
Daily Range
$90.70 - $91.87
52-Week Range
$75.01 - $134.12
Dividend
$0.00
Beta (Volatility)
1.27 (Average)
Price
$91.87
Volume
1,479,498
Open
$91.31
Previous Close
$91.87
Daily Range
$90.70 - $91.87
52-Week Range
$75.01 - $134.12
NFLX News

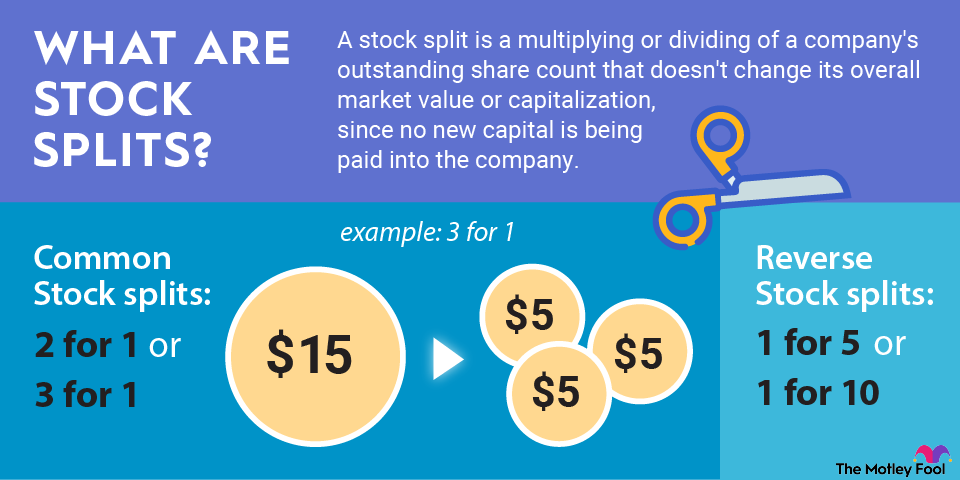
Upcoming Stock Splits in 2026


2 Stocks to Buy in March
NFLX: Motley Fool Moneyball Superscore
Our CEO Is Handing Members His Secret Weapon
It's called Motley Fool Moneyball, our new proprietary AI tool
We spent over half a million dollars in R&D to build a tool that makes stock research faster, sharper, and smarter. Our analysts use it every day, and now, you can too.
Get Access NowAbout Netflix
Industry
Entertainment
Sector
Communication ServicesEmployees
16,000
CEO
Gregory K. Peters; Theodore A. Sarandos
Website
www.netflix.comHeadquarters
Los Gatos, CA 95032, US
NFLX Financials
Key Financial Metrics (TTM)
Gross Margin
48%
Operating Margin
29%
Net Income Margin
24%
Return on Equity
43%
Return on Capital
30%
Return on Assets
20%
Earnings Yield
2.75%
Dividend Yield
0.00%
Payout Ratio
0.00%
Stock Overview
Market Cap
$387.68B
Shares Outstanding
4.22B
Volume
1.48M
Short Interest
0.00%
Avg. Volume
47.93M
Financials (TTM)
Gross Profit
$21.91B
Operating Income
$13.33B
EBITDA
$30.25B
Operating Cash Flow
$10.15B
Capital Expenditure
$688.22M
Free Cash Flow
$9.46B
Cash & ST Invst.
$9.06B
Total Debt
$14.46B
Netflix Performance Analysis
Revenue Growth Rate
Annual and quarterly growth comparisonEarnings Per Share Growth Rate
Annual and quarterly EPS growth comparisonQuarterly Performance
Revenue
$12.05B
+17.6%
Gross Profit
$5.53B
+23.4%
Gross Margin
45.87%
N/A
Market Cap
$387.68B
N/A
Market Cap/Employee
$27.69M
N/A
Employees
14,000
N/A
Net Income
$2.42B
+29.4%
EBITDA
$7.85B
+19.6%
Quarterly Fundamentals
Net Cash
$5.40B
+35.8%
Accounts Receivable
$2.58B
+29.9%
Inventory
$0.00
N/A
Long Term Debt
$13.46B
-14.7%
Short Term Debt
$998.87M
-54.9%
Return on Assets
19.75%
N/A
Return on Invested Capital
29.87%
N/A
Free Cash Flow
$1.87B
+35.8%
Operating Cash Flow
$2.11B
+37.4%