Accessibility Menu
C3.ai logo

C3.ai(NYSE) AI

Current Price$8.17
Market Cap$1.27BMarket cap calculated using publicly traded shares outstanding only. Does not include unlisted, private, or dual-class non-traded shares. Implied market cap may vary.
Since IPO (2020)-91%
5 Year-84%
1 Year-72%
1 Month-16%
C3.ai last closing stock price
MetricPriceDate
Last closeUSD 8.152026-07-23
C3.ai stock price return by period
PeriodPrice returnPrice at period startPeriod start date
1 week-8.53%USD 8.912026-07-16
1 month-15.81%USD 9.682026-06-23
3 month-5.67%USD 8.642026-04-24
Year to date-39.54%USD 13.482025-12-31
1 year-72.05%USD 29.162025-07-23
3 year-78.65%USD 38.172023-07-24
5 year-84.13%USD 51.362021-07-23
Since inception-91.19%USD 92.492020-12-09

C3.ai Financials at a Glance

Market Cap

$1.27BMarket cap calculated using publicly traded shares outstanding only. Does not include unlisted, private, or dual-class non-traded shares. Implied market cap may vary.

Revenue (TTM)

$250.27M

Net Income (TTM)

-$470.37M

EPS (TTM)

-$3.35

P/E Ratio

-2.43

Dividend

$0.00

Beta (Volatility)

2.13 (High)

Price

$8.17

Volume

28

Open

$8.11

Previous Close

$8.17

Daily Range

$7.91 - $8.18

52-Week Range

$7.68 - $26.59

Estimated Earnings Date

Sep 2, 2026

AI: Motley Fool Moneyball Superscore

43

Our CEO Is Handing Members His Secret Weapon

It's called Motley Fool Moneyball, our new proprietary AI tool

We spent over half a million dollars in R&D to build a tool that makes stock research faster, sharper, and smarter. Our analysts use it every day, and now, you can too.

Get Access Now

About C3.ai

C3.ai makes software that helps big companies use artificial intelligence. This technology helps businesses solve complex problems in their daily operations. It serves many industries including energy, defense, and financial services.

The AI Toolkit

  • C3 Agentic AI Platform: Software environment for designing and running custom business applications; part of the subscription segment that made up 90% of revenue in Q3 2026.
  • C3 AI Applications: Pre-made tools for specific tasks like tracking inventory or spotting supply chain risks.
  • C3 Generative AI: Tools that use large language models—systems trained to understand and generate text—to find information in business databases.
  • Professional Services: Engineering and training support for customers; accounted for 10% of total revenue in Q3 2026.

Alliances and Efficiency Moves

  • Established strategic alliances with cloud providers including AWS, Google Cloud, and Microsoft Azure.
  • Maintains an industry partnership with Baker Hughes to develop software for the oil and gas market.
  • Approved a restructuring plan in February 2026 to reduce the global workforce by 26%.
  • Launched a lawsuit in February 2024 against Enel seeking €2.1 billion for alleged trade secret misappropriation.

A Specialized Approach

The company uses a model-driven architecture to simplify software development for large organizations. Operations are heavily concentrated in the United States, which generated 88% of revenue in the third quarter of 2026.

A Look at the Numbers

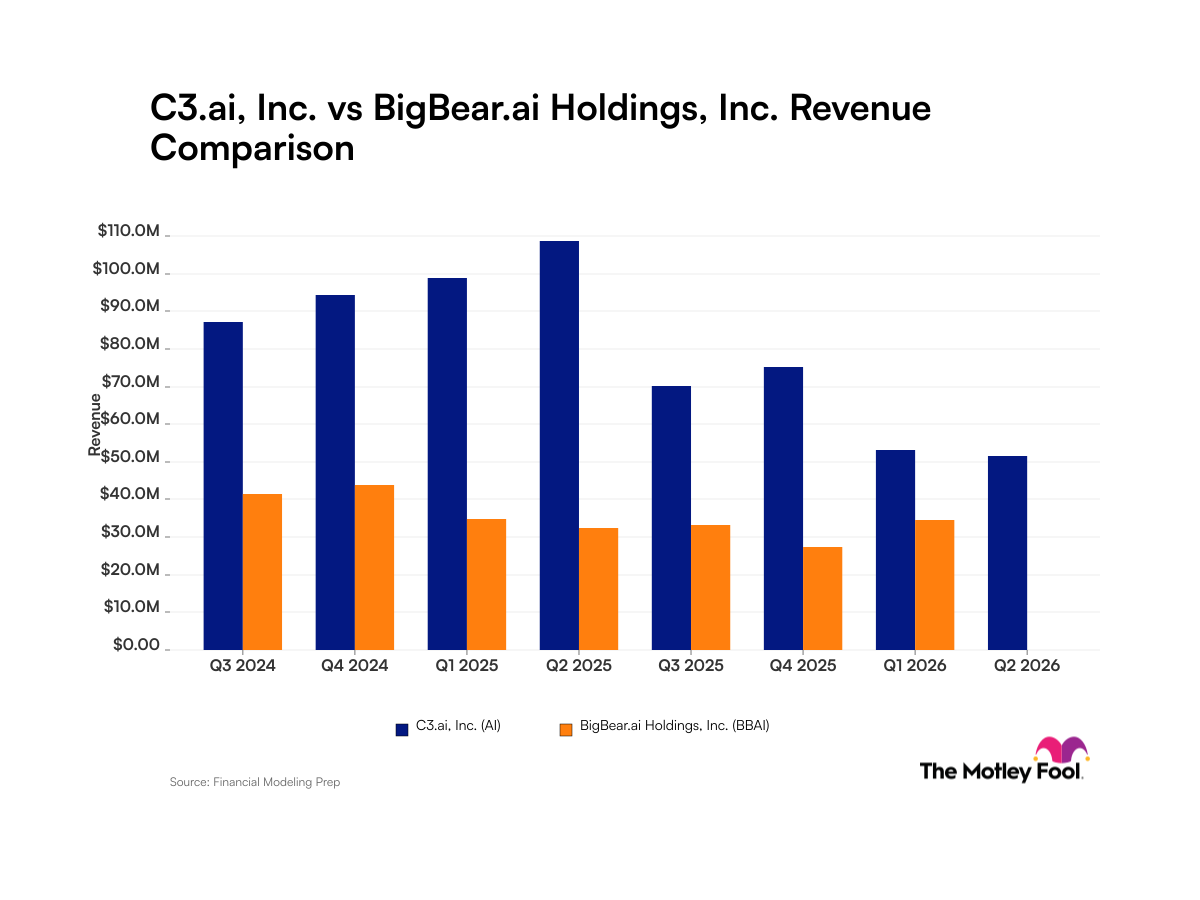
  • Total revenue fell to $53.3 million in Q3 2026, down 46.1% from the previous year.
  • Gross profit reached $9.2 million in Q3 2026, down 84.2% year-over-year.
  • Net loss reached $133.4 million in Q3 2026, which worsened by 66.3% from $80.2 million in Q3 2025.
  • Free cash flow was negative $56.2 million in Q3 2026, worsening 151.1% from the prior year.

Evolution and Strategy

C3.ai is currently navigating a major restructuring and a shift toward consumption-based pricing models. The firm continues to expand its offerings in generative AI and specialized software platforms for industrial and government sectors.

AI Generated • May 20, 2026

Industry

Software

Employees

764

CEO

Stephen Bradley Ehikian

Website

www.c3.ai

Headquarters

Redwood City, CA 94063, US

AI Financials

Key Financial Metrics (TTM)

Gross Margin

30.92%

Operating Margin

-194.86%

Net Income Margin

-187.95%

Return on Equity

-63.91%

Return on Capital

-73.96%

Return on Assets

-57.62%

Earnings Yield

-41.15%

Dividend Yield

0.00%

Payout Ratio

0.00%

Stock Overview

Market Cap

$1.27BMarket cap calculated using publicly traded shares outstanding only. Does not include unlisted, private, or dual-class non-traded shares. Implied market cap may vary.

Shares Outstanding

155.45M

Volume

28

Avg. Volume

6.15M

Financials (TTM)

Gross Profit

$77.38M

Operating Income

-$487.67M

EBITDA

-$459.33M

Operating Cash Flow

-$188.79M

Capital Expenditure

-$1.91M

Free Cash Flow

-$190.69M

Cash & ST Invst.

$575.45M

Total Debt

$5.58M

C3.ai Performance Analysis

C3.ai annual revenue and year-over-year revenue growth by fiscal year
Fiscal yearPeriod endRevenueYoY growth
20232023-04-30USD 266,795,0005.6%
20242024-04-30USD 310,582,00016.4%
20252025-04-30USD 389,056,00025.3%
20262026-04-30USD 250,268,000-35.7%
C3.ai sequential (quarter-over-quarter) revenue growth by fiscal quarter
Fiscal quarterPeriod endQoQ growth
Q12025-07-31-35.4%
Q22025-10-317.0%
Q32026-01-31-29.1%
Q42026-04-30-3.1%
C3.ai annual diluted earnings per share and year-over-year EPS growth by fiscal year
Fiscal yearPeriod endDiluted EPSYoY growth
20232023-04-30USD -2.4535.4%
20242024-04-30USD -2.34-4.2%
20252025-04-30USD -2.24-4.6%
20262026-04-30USD -3.3549.7%
C3.ai sequential (quarter-over-quarter) diluted earnings per share growth by fiscal quarter
Fiscal quarterPeriod endQoQ growth
Q12025-07-31-43.3%
Q22025-10-3112.8%
Q32026-01-31-26.7%
Q42026-04-3016.8%

Revenue Growth Rate

Annual and quarterly growth comparison

Earnings Per Share Growth Rate

Annual and quarterly EPS growth comparison

Quarterly Performance

Name
Q4 2026YOY CHG

Revenue

$51.60M

-52.5%

Gross Profit

$11.32M

-83.2%

Gross Margin

21.94%

N/A

Market Cap

$1.27BMarket cap calculated using publicly traded shares outstanding only. Does not include unlisted, private, or dual-class non-traded shares. Implied market cap may vary.

N/A

Market Cap/Employee

$1.66M

N/A

Employees

764

N/A

Net Income

-$115.57M

-45.0%

EBITDA

-$115.46M

-51.5%

Quarterly Fundamentals

Name
Q4 2026YOY CHG

Total Cash

$575.45M

-22.5%

Total Debt

$5.58M

+16.3%

Accounts Receivable

$100.55M

-26.7%

Inventory

$0.00

N/A

Long Term Debt

$0.00

N/A

Short Term Debt

$5.58M

+16.3%

Return on Assets

-57.62%

N/A

Return on Invested Capital

-68.71%

N/A

Free Cash Flow

-$53.32M

-616.4%

Operating Cash Flow

-$53.00M

-570.5%

Other Investments to Explore

People Also Watch

Symbol / CompanyPricePrice Chg
CLVTClarivate Plc
$1.94-2.51%
GLOBGlobant S.A.
$30.61-0.20%
CNXCConcentrix Corporation
$21.94-8.16%
PGYPagaya Technologies Ltd.
$16.26-3.56%

Trending Stocks

Symbol / CompanyPricePrice Chg
TSLLDirexion Shares ETF Trust - Direxion Daily Tsla Bull 2x Shares
$7.76-0.29%
MUUDirexion Shares ETF Trust - Direxion Daily Mu Bull 2x Shares
$36.49+0.06%
SQQQProShares Trust - ProShares UltraPro Short Qqq
$43.27+0.06%
NOKNokia
$9.73-0.05%

Questions About AI

What is the current price of C3.ai?

C3.ai is trading at $8.17 per share.

What is the 52-week range for C3.ai?

Over the past 52 weeks, C3.ai has traded between $7.68 and $26.59.

How much debt does C3.ai have?

As of the most recent reporting period, C3.ai reported total debt of $58.68M.

How much cash does C3.ai have on hand?

C3.ai reported $66.20M in cash and cash equivalents in its most recent financial results.

What is C3.ai’s dividend yield?

C3.ai does not currently have a dividend yield.

Premium Investing Services

Invest better with The Motley Fool. Get stock recommendations, portfolio guidance, and more from The Motley Fool's premium services.