
Eni S.p.A.
(NYSE) E
Eni S.p.A. Financials at a Glance
Market Cap
$77.03B
Revenue (TTM)
$78.91B
Net Income (TTM)
$2.61B
EPS (TTM)
$1.82
P/E Ratio
28.66
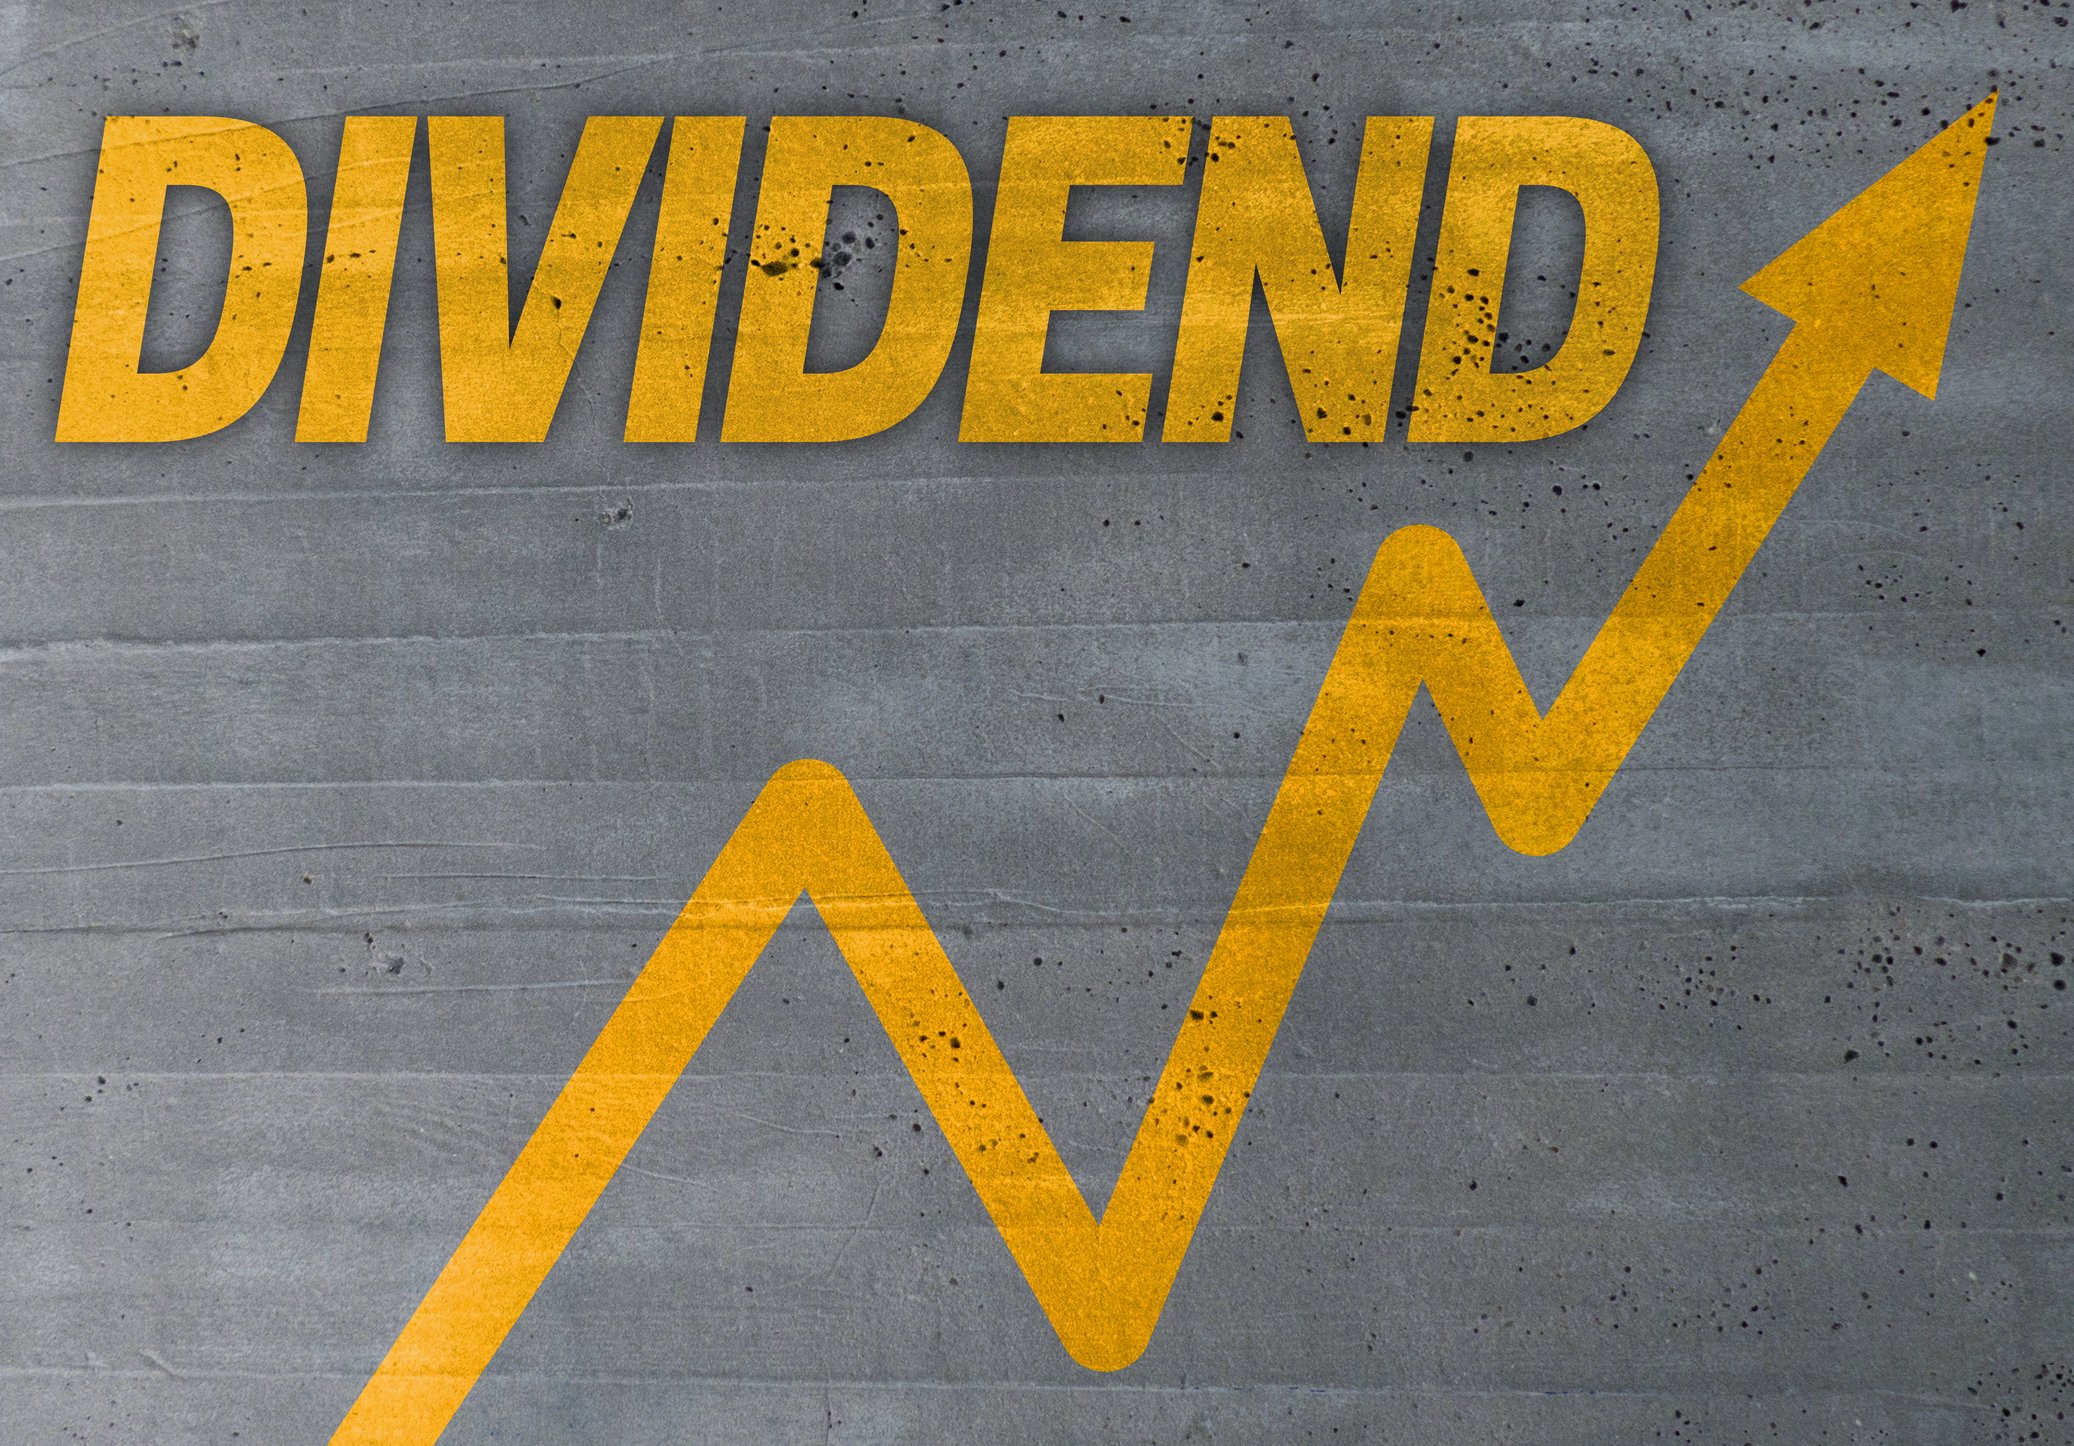
Dividend
$2.32
Beta (Volatility)
0.61 (Low)
Dividend
$2.32
Beta (Volatility)
0.61 (Low)
Price
$54.47
Volume
1,326,495
Open
$54.32
Price
$54.47
Volume
1,326,495
Open
$54.32
Previous Close
$54.54
Daily Range
$53.98 - $55.08
52-Week Range
$24.65 - $55.38
Dividend
$2.32
Beta (Volatility)
0.61 (Low)
Price
$54.47
Volume
1,326,495
Open
$54.32
Previous Close
$54.54
Daily Range
$53.98 - $55.08
52-Week Range
$24.65 - $55.38
E News


3 Top Energy Stocks to Buy in June

E: Motley Fool Moneyball Superscore
Our CEO Is Handing Members His Secret Weapon
It's called Motley Fool Moneyball, our new proprietary AI tool
We spent over half a million dollars in R&D to build a tool that makes stock research faster, sharper, and smarter. Our analysts use it every day, and now, you can too.
Get Access NowAbout Eni S.p.A.
Industry
Oil, Gas and Consumable Fuels
Sector
EnergyEmployees
32,492
CEO
Claudio Descalzi
Website
www.eni.comHeadquarters
Rome, RM 00144, IT
E Financials
Key Financial Metrics (TTM)
Gross Margin
14%
Operating Margin
7%
Net Income Margin
3%
Return on Equity
5%
Return on Capital
6%
Return on Assets
2%
Earnings Yield
3.49%
Dividend Yield
0.04%
Payout Ratio
1.18%
Stock Overview
Market Cap
$77.03B
Shares Outstanding
1.41B
Volume
1.33M
Short Interest
0.00%
Avg. Volume
388.24K
Financials (TTM)
Gross Profit
$4.34B
Operating Income
$5.75B
EBITDA
$12.81B
Operating Cash Flow
$12.80B
Capital Expenditure
$8.36B
Free Cash Flow
$4.45B
Cash & ST Invst.
$15.08B
Total Debt
$38.62B
Eni S.p.A. Performance Analysis
Revenue Growth Rate
Annual and quarterly growth comparisonEarnings Per Share Growth Rate
Annual and quarterly EPS growth comparisonQuarterly Performance
Revenue
$17.37B
-26.0%
Gross Profit
$2.28B
-228.1%
Gross Margin
-13.14%
N/A
Market Cap
$77.03B
N/A
Market Cap/Employee
$2.37M
N/A
Employees
32,492
N/A
Net Income
$89.16M
-61.2%
EBITDA
$2.64B
-51.2%
Quarterly Fundamentals
Net Cash
$23.54B
-7.7%
Accounts Receivable
$12.97B
-1.6%
Inventory
$5.14B
-17.9%
Long Term Debt
$29.00B
+8.4%
Short Term Debt
$9.62B
-4.7%
Return on Assets
1.90%
N/A
Return on Invested Capital
5.53%
N/A
Free Cash Flow
$1.48B
+20.9%
Operating Cash Flow
$4.34B
+19.9%