
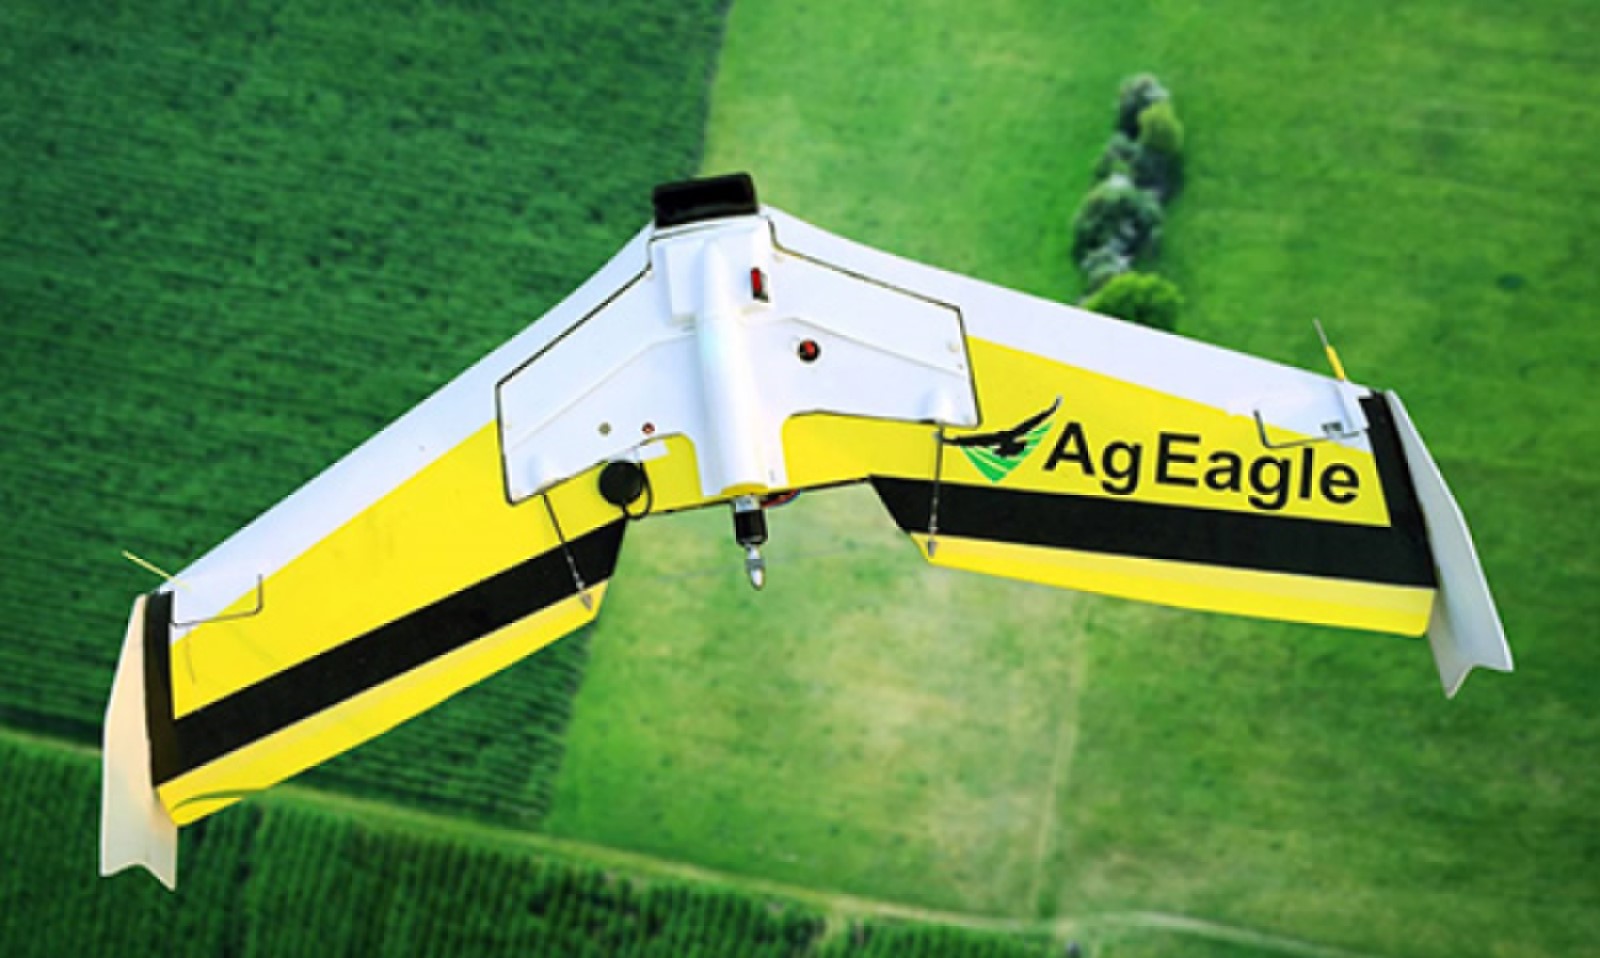
AgEagle Aerial Systems
(NYSEMKT) UAVS
AgEagle Aerial Systems Financials at a Glance
Market Cap
$61.11M
Revenue (TTM)
$10.56M
Net Income (TTM)
$20.08M
EPS (TTM)
$-0.75
P/E Ratio
-1.39
Dividend
$0.00
Beta (Volatility)
1.80 (High)
Dividend
$0.00
Beta (Volatility)
1.80 (High)
Price
$1.07
Volume
47,056
Open
$1.07
Price
$1.07
Volume
47,056
Open
$1.07
Previous Close
$1.07
Daily Range
$1.03 - $1.07
52-Week Range
$0.75 - $3.60
Dividend
$0.00
Beta (Volatility)
1.80 (High)
Price
$1.07
Volume
47,056
Open
$1.07
Previous Close
$1.07
Daily Range
$1.03 - $1.07
52-Week Range
$0.75 - $3.60
UAVS News


Motley Fool Moneyball Superscore
Our CEO Is Handing Members His Secret Weapon
It's called Motley Fool Moneyball, our new proprietary AI tool
We spent over half a million dollars in R&D to build a tool that makes stock research faster, sharper, and smarter. Our analysts use it every day, and now, you can too.
Get Access NowAbout AgEagle Aerial Systems
Industry
Machinery
Sector
IndustrialsEmployees
58
CEO
William Irby
Website
www.ageagle.comHeadquarters
Wichita, KS 67226, US
UAVS Financials
Key Financial Metrics (TTM)
Gross Margin
48%
Operating Margin
-1%
Net Income Margin
-2%
Return on Equity
-35%
Return on Capital
-30%
Return on Assets
-42%
Earnings Yield
-71.94%
Dividend Yield
0.00%
Payout Ratio
-4.96%
Stock Overview
Market Cap
$61.11M
Shares Outstanding
58.20M
Volume
47.06K
Avg. Volume
2.66M
Financials (TTM)
Gross Profit
$6.64M
Operating Income
$8.94M
EBITDA
$4.46M
Operating Cash Flow
$9.96M
Capital Expenditure
$74.66K
Free Cash Flow
$10.03M
Cash & ST Invst.
$29.86M
Total Debt
$2.19M
AgEagle Aerial Systems Performance Analysis
Revenue Growth Rate
Annual and quarterly growth comparisonEarnings Per Share Growth Rate
Annual and quarterly EPS growth comparisonQuarterly Performance
Revenue
$1.40M
-61.6%
Gross Profit
$584.93K
-72.6%
Gross Margin
41.74%
N/A
Market Cap
$61.11M
N/A
Market Cap/Employee
$1.22M
N/A
Employees
50
N/A
Net Income
$39.88K
-99.4%
EBITDA
$5.10M
-169.2%
Quarterly Fundamentals
Net Cash
$24.30M
+5787.8%
Accounts Receivable
$753.39K
-33.2%
Inventory
$5.72M
+6.1%
Long Term Debt
$2.61M
+52.7%
Short Term Debt
$0.00
-100.0%
Return on Assets
-41.73%
N/A
Return on Invested Capital
-29.80%
N/A
Free Cash Flow
$2.72M
-108.2%
Operating Cash Flow
$2.36M
-82.3%