You may have heard the term "percent change" thrown around a lot in investing circles. But what does it mean? Why should you care about it? And how can you use it to make better investment decisions?
Let’s have a look.
What is percent change?
What is percent change?
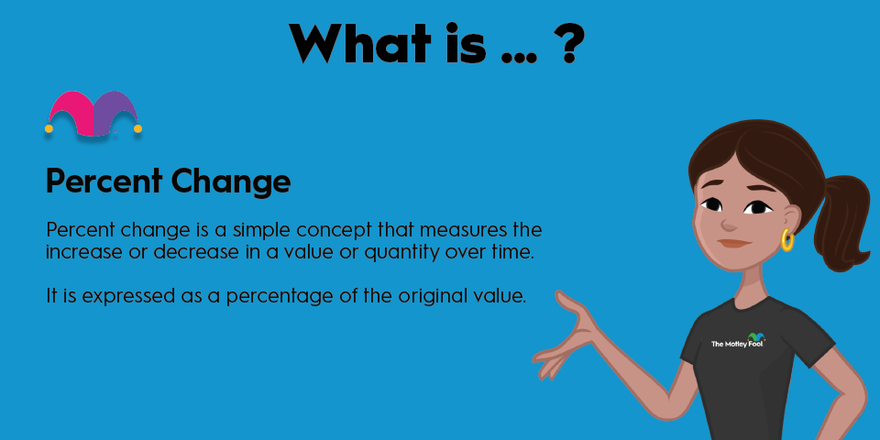
Percent change is a simple concept that measures the increase or decrease in a value or quantity over time. It is expressed as a percentage of the original value. For example, if the price of a stock increases from $40 to $50, the value increases by 25%. Similarly, if the price of a stock falls from $50 to $40, it drops 20%.
How it helps investors
How percent change helps investors
At first glance, percent change may seem like a trivial concept. After all, why should investors care about the percentage increase or decrease in a stock's price when the rise and fall of dollar values really matters? The answer lies in the fact that percent change provides a standardized way of comparing investments with different starting values.
Let's say you are looking at two stocks such as e-commerce giant Amazon (AMZN 3.43%) and electric vehicle maker NIO (NIO 8.72%). You see Amazon trading at roughly $100 per share, while NIO’s shares are priced around $10. The dollar value of an Amazon share is 10 times a NIO share, but does that mean it's a better investment?
Not necessarily. Share prices only reflect the total market value of a company divided by the number of shares in circulation. Amazon has issued roughly 9 billion shares, while NIO’s share count stops at 1.5 billion stubs. As measured by market value, Amazon is about 60 times more valuable than the Chinese vehicle maker. The basic stock price almost never says anything useful about the growth prospects or fair market value of any company.
Let’s say that both NIO’s and Amazon’s share prices increase by $1. That would be a big day for NIO, whose market value would increase by 10%. The same price gain would boost the value of your Amazon holdings by just 1%.
Seen from the opposite side of the equation, a 10% price gain would lift NIO’s stock from $10 to $11 per share. A 10% jump for Amazon moves the stock price from $100 to $110.
In addition to providing a standardized way of comparing investments, percent change can also help you track the volatility of your portfolio. A stock that has a high percent change over a short period of time is likely to be more volatile than one with a low percent change. Moves measured in pure dollar values aren’t very helpful for this purpose, since a $10 change can be huge for one stock but just a rounding error for another.
The benefits of tracking percent change
The benefits of tracking percent change
How can you use percent changes to make better investment decisions? Here are a few tips:
- Look beyond the dollar value: When evaluating investments, don't just focus on the dollar value change. Consider the percent change as well to get a more accurate picture of the investment's performance.
- Track percent change over time: By tracking the percent change of your investments over time, you can gain a better understanding of their volatility and risk.
- Use percent change to compare investments: When evaluating multiple investments, use percent change as a standardized way of comparing them, regardless of their relative size and different share counts.
Keep an eye on the overall market: The percent change of individual stocks is affected by the overall performance of the market. By monitoring the percent change of major indices, such as the S&P 500 (SNPINDEX:^GSPC) or Dow Jones Industrial Average (DJINDICES:^DJI), you can gain a better understanding of the direction of the market and make more informed investment decisions.
Navigating the percentage changes in 2020
Navigating the percentage changes in 2020
Let's look at a real-world example of percent change in action. In 2020, the stock market experienced a significant downturn due to the COVID-19 pandemic. The S&P 500 index fell by 34% between the start of the drop on February 19 and the rock-bottom reading of March 23.
Although this may seem like a significant plunge, it was also a quick crash and it’s important to consider the percent change over the longer term. From March 23 to Dec. 31, 2020, the S&P 500 index increased by 68% as investors looked past the health crisis with effective vaccines on the horizon. All told, the S&P 500 gained 16% in 2020.
By looking at the percent change over the entire year, investors can see that the market actually recovered from the pandemic-induced downturn and ended up posting impressive gains. A short-term decrease in value may be concerning, but if the investment has a history of positive long-term performance, it may still be a sound investment. Keeping an eye on percentage changes in light of market-moving news can help you buy the dip or stay on the sidelines, as appropriate.
If you get used to looking at percent changes instead of dollar changes, and to put these price moves into the context of longer periods and the overall market’s returns in the same time spans, you’ll find it easier to monitor and evaluate your investments.

