Wildfire Insurance Statistics
KEY POINTS
- WILDFIRE RISK INCREASES : Climate change is intensifying wildfire risks, affecting more homes each year.
- INSURANCE COVERAGE CHALLENGES : Homeowners in high-risk areas may struggle to find insurance coverage due to increasing wildfire threats.
- PROACTIVE MEASURES ESSENTIAL : Homeowners should verify their insurance policies for fire damage coverage and consider standalone policies if necessary.
Millions of homes are at risk of wildfires, which are becoming more intense and impacting larger areas due to climate change.
Armed with facts about wildfire risk, homeowners can make better informed decisions about where to buy a home and what type of insurance to seek.
Homeowners insurance generally covers fire damage, although insurers are no longer willing to cover homes in certain extremely high-risk areas.
Read on for a roundup of the areas most at risk of wildfire damage and tips for shopping for homeowners insurance with wildfires in mind.
Fire insurance statistics by state
California, Texas, and Colorado have the most homes at high and extreme risk of wildfire damage, according to Verisk, a risk assessment firm.
Homes at risk of wildfires by state
In California, just over 2 million -- or 15% -- of homes are at high or extreme risk of wildfires, per Verisk.
Texas has the second-most homes at high or extreme risk of wildfires, about 718,000 or roughly 7% of the homes in the state.
Montana has the largest percentage of homes at high or extreme wildfire risk -- 29%. That amounts to 137,800 homes.
| State | Number of homes at high or extreme risk | Percentage of homes at high and extreme risk | Number of homes at moderate risk | Percentage of homes at moderate risk |
|---|---|---|---|---|
| California | 2,040,600 | 15% | 1,648,100 | 12% |
| Texas | 717,800 | 7% | 2,355,400 | 24% |
| Colorado | 373,900 | 17% | 301,700 | 14% |
| Arizona | 242,000 | 9% | 490,800 | 17% |
| Idaho | 175,000 | 26% | 125,100 | 19% |
| Washington | 155,500 | 5% | 427,200 | 15% |
| Oklahoma | 153,400 | 9% | 344,000 | 21% |
| Oregon | 147,500 | 9% | 341,800 | 20% |
| Montana | 137,800 | 29% | 119,200 | 25% |
| Utah | 136,000 | 14% | 137,100 | 14% |
| New Mexico | 131,600 | 15% | 220,500 | 24% |
| Nevada | 67,100 | 6% | 116,300 | 10% |
| Wyoming | 36,800 | 14% | 72,000 | 27% |
Wildfire risk by county
Six of the top 10 and four of the top five counties most at risk of wildfires according to FEMA are in California.
These counties have the highest wildfire risk, per FEMA:
| County | Homes at risk of wildfire damage | FEMA Wildfire Risk score |
|---|---|---|
| San Diego, CA | 252,500 | 100.00 |
| Riverside, CA | 79,400 | 99.97 |
| San Bernardino, CA | 112,700 | 99.94 |
| Los Angeles,CA | 434,400 | 99.90 |
| Elko, NV | 4,100 | 99.84 |
| Pima, AZ | 43,900 | 99.75 |
| Maricopa, AZ | 54,800 | 99.71 |
| Yavapai, AZ | 36,500 | 99.62 |
| Jefferson, CO | 43,000 | 99.4 |
| Coconino, AZ | 18,200 | 99.3 |
Los Angeles County has the most homes at risk of wildfire damage, just over 434,000, according to Verisk.
Some 253,000 homes are at risk of wildfires in San Diego County, and 113,000 are at risk in San Bernardino County.
Top counties at risk of wildfires in Arizona
| State | County | Homes at risk of wildfire damage | FEMA wildfire risk score |
|---|---|---|---|
| Arizona | Maricopa | 54,800 | 99.71 |
| Arizona | Pima | 43,900 | 99.75 |
| Arizona | Yavapai | 36,500 | 99.62 |
| Arizona | Gila | 23,500 | 99.27 |
| Arizona | Coconino | 18,200 | 99.3 |
Top counties at risk of wildfires in California
| State | County | Homes at risk of wildfire damage | FEMA Wildfire Risk score |
|---|---|---|---|
| California | Los Angeles | 434,400 | 99.90 |
| California | San Diego | 252,500 | 100.00 |
| California | San Bernardino | 112,700 | 99.94 |
| California | Riverside | 79,400 | 99.97 |
| California | Alameda | 78,300 | 96.18 |
Top counties at risk of wildfires in Colorado
| State | County | Homes at risk of wildfire damage | FEMA Wildfire Risk score |
|---|---|---|---|
| Colorado | Jefferson | 43,000 | 99.4 |
| Colorado | Larimer | 38,300 | 96.69 |
| Colorado | Boulder | 24,600 | 96.72 |
| Colorado | El Paso | 22,400 | 98.19 |
| Colorado | Summit | 20,600 | 97.17 |
Top counties at risk of wildfires in Idaho
| State | County | Homes at risk of wildfire damage | FEMA Wildfire Risk score |
|---|---|---|---|
| Idaho | Kootenai | 38,500 | 57.56 |
| Idaho | Ada | 18,200 | 99.11 |
| Idaho | Bonner | 16,200 | 78.52 |
| Idaho | Bannock | 9,900 | 95.86 |
| Idaho | Blaine | 7,400 | 92.4 |
Top counties at risk of wildfires in Montana
| State | County | Homes at risk of wildfire damage | FEMA Wildfire Risk score |
|---|---|---|---|
| Montana | Flathead | 24,600 | 94.15 |
| Montana | Missoula | 17,400 | 95.55 |
| Montana | Gallatin | 14,700 | 89.63 |
| Montana | Lewis and Clark | 11,700 | 88.96 |
| Montana | Silver Bow | 9,100 | 76.33 |
Top counties at risk of wildfires in Nevada
| State | County | Homes at risk of wildfire damage | FEMA Wildfire Risk score |
|---|---|---|---|
| Nevada | Washoe | 40,500 | 97.65 |
| Nevada | Douglas | 7,900 | 96.12 |
| Nevada | Carson City | 6,400 | 87.18 |
| Nevada | Elko | 4,100 | 99.84 |
| Nevada | Lyon | 2,300 | 95 |
Top counties at risk of wildfires in New Mexico
| State | County | Homes at risk of wildfire damage | FEMA Wildfire Risk score |
|---|---|---|---|
| New Mexico | Santa Fe | 25,700 | 98.28 |
| New Mexico | Bernalillo | 12,700 | 86.35 |
| New Mexico | Lincoln | 12,000 | 98.54 |
| New Mexico | Taos | 8,800 | 95.9 |
| New Mexico | Doña Ana | 8,700 | 84.47 |
Top counties at risk of wildfires in Oklahoma
| State | County | Homes at risk of wildfire damage | FEMA Wildfire Risk score |
|---|---|---|---|
| Oklahoma | Tulsa | 13,000 | 94.21 |
| Oklahoma | Oklahoma | 12,600 | 84.92 |
| Oklahoma | Delaware | 8,600 | 93.35 |
| Oklahoma | Cherokee | 8,300 | 96.56 |
| Oklahoma | Cleveland | 7,700 | 83.74 |
Top counties at risk of wildfires in Oregon
| State | County | Homes at risk of wildfire damage | FEMA Wildfire Risk score |
|---|---|---|---|
| Oregon | Jackson | 31,900 | 96.5 |
| Oregon | Deschutes | 21,200 | 98.12 |
| Oregon | Josephine | 20,100 | 97.36 |
| Oregon | Douglas | 12,100 | 96.12 |
| Oregon | Klamath | 6,300 | 85.05 |
Top counties at risk of wildfires in Texas
| State | County | Homes at risk of wildfire damage | FEMA Wildfire Risk score |
|---|---|---|---|
| Texas | Travis | 83,800 | 93.29 |
| Texas | Bexar | 48,500 | 95.23 |
| Texas | Bell | 28,100 | 93.22 |
| Texas | Williamson | 24,700 | 94.18 |
| Texas | Hays | 22,600 | 92.01 |
Top counties at risk of wildfires in Utah
| State | County | Homes at risk of wildfire damage | FEMA Wildfire Risk score |
|---|---|---|---|
| Utah | Salt Lake | 35,100 | 99.24 |
| Utah | Summit | 17,100 | 97.17 |
| Utah | Utah | 16,200 | 82.96 |
| Utah | Davis | 8,400 | 87.88 |
| Utah | Weber | 8,200 | 93.38 |
Top counties at risk of wildfires in Washington
| State | County | Homes at risk of wildfire damage | FEMA Wildfire Risk score |
|---|---|---|---|
| Washington | Spokane | 44,900 | 94.65 |
| Washington | Chelan | 15,900 | 99.17 |
| Washington | Stevens | 12,900 | 93.76 |
| Washington | Kittitas | 10,800 | 98.57 |
| Washington | Yakima | 9,900 | 98.60 |
Top counties at risk of wildfires in Wyoming
| State | County | Homes at risk of wildfire damage | FEMA Wildfire Risk score |
|---|---|---|---|
| Wyoming | Teton | 5,900 | 89.31 |
| Wyoming | Natrona | 5,100 | 90.2 |
| Wyoming | Park | 3,300 | 92.11 |
| Wyoming | Albany | 3,100 | 80.43 |
| Wyoming | Sheridan | 3,000 | 86 |
Wildfire statistics by state
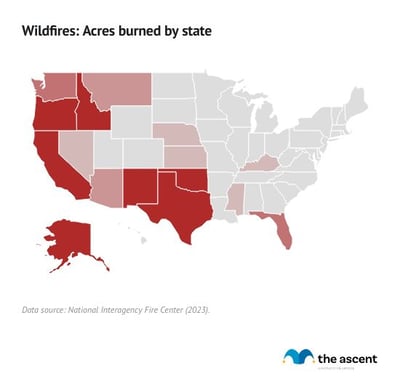
Sixty-nine thousand wildfires burned 7.6 million acres across the United States in 2022, according to the National Interagency Fire Center.
Over 3 million acres burned in Alaska alone. Nearly 860,000 acres burned in New Mexico and 672,000 acres burned in Texas.
Texas also experienced the most wildfires, with 12,571 burning in the state in 2022. There were 7,884 wildfires in California which flared across 309,000 acres.
| State | Fires | Acres |
|---|---|---|
| Alabama | 2,710 | 40,975 |
| Alaska | 595 | 3,110,976 |
| Arizona | 1,432 | 124,165 |
| Arkansas | 1,903 | 39,028 |
| California | 7,884 | 309,287 |
| Colorado | 835 | 45,732 |
| Connecticut | 150 | 347 |
| Delaware | 7 | 79 |
| Florida | 2,784 | 164,774 |
| Georgia | 3,621 | 25,017 |
| Hawaii | 5 | 25,053 |
| Idaho | 1,088 | 436,733 |
| Illinois | 32 | 298 |
| Indiana | 49 | 1,643 |
| Iowa | 7 | 288 |
| Kansas | 67 | 84,015 |
| Kentucky | 1,280 | 59,199 |
| Louisiana | 1,259 | 24,475 |
| Maine | 730 | 425 |
| Maryland | 117 | 3,139 |
| Massachusetts | 1,192 | 1,756 |
| Michigan | 376 | 3,522 |
| Minnesota | 713 | 3,715 |
| Mississippi | 1,980 | 53,170 |
| Missouri | 136 | 4,968 |
| Montana | 2,087 | 137,509 |
| Nebraska | 568 | 76,534 |
| Nevada | 506 | 58,402 |
| New Hampshire | 103 | 381 |
| New Jersey | 1,165 | 15,532 |
| New Mexico | 748 | 859,906 |
| New York | 162 | 1,313 |
| North Carolina | 6,222 | 28,851 |
| North Dakota | 111 | 1,509 |
| Ohio | 724 | 3,063 |
| Oklahoma | 2,811 | 385,133 |
| Oregon | 2,117 | 456,082 |
| Pennsylvania | 951 | 2,588 |
| Rhode Island | 76 | 44 |
| South Carolina | 22 | 677 |
| South Dakota | 527 | 42,148 |
| Tennessee | 1,225 | 15,059 |
| Texas | 12,571 | 671,800 |
| Utah | 945 | 27,245 |
| Vermont | 86 | 83 |
| Virginia | 558 | 9,956 |
| Washington | 1,492 | 173,659 |
| West Virginia | 893 | 20,275 |
| Wisconsin | 923 | 881 |
| Wyoming | 443 | 25,766 |
Wildfire statistics by year
While the number of fires occurring each year has held relatively steady since 1985, the amount of acres impacted has steadily increased.
- The average amount of acres burned each year from wildfires from 1983, when the National Interagency Fire Center began collecting data, to 1989 was about 2.5 million.
- From 1990 to 1999, the average number of acres burned annually grew to 3.3 million.
- In the 2000s, average acreage impacted by wildfires each year skyrocketed to 6.9 million.
- Roughly 6.8 million acres burned annually on average in the 2010s.
- From 2020 to 2022, 8.3 million acres have been impacted by wildfires on average each year.
California fire insurance
State Farm and Allstate made headlines in 2023 when they announced they would no longer offer new homeowners insurance applications in light of growing wildfire risks and the potential insurance costs that come with it.
With homeowners in California, particularly those in fire-prone areas, facing few or no homeowners insurance options, the state in 2020 set up a state-run homeowners insurance pool, the California Fair Access to Insurance Requirements plan, or FAIR.
Homeowners can receive basic fire insurance through FAIR when they are unable to get that coverage from insurance companies. In 2022, 272,846 homes enrolled in FAIR.
California is not the only state to have an unsettled insurance market due to natural disasters.
Three-fourths of insurance carriers have lowered their exposure in Colorado after severe wildfires, according to a study from the Colorado state government.
Louisiana and Florida homeowners also struggle to find affordable homeowners insurance or any coverage at all due to hurricane and flood risks made worse by climate change.
How to get insured for wildfires
Homeowners in wildfire-prone areas can take the following steps to get insured and prepared.
- Check if your homeowners insurance policy currently covers fire damage. In most cases it will, but not always, especially for homeowners in high-risk areas.
- If your plan does not cover fire damage, consider purchasing standalone fire insurance.
- For homeowners in California, if fire insurance is not available through a private insurer, apply for coverage through the FAIR Plan.
FAQs
Homeowners insurance generally covers fire damage. In some areas that are extremely prone to wildfires, fire damage may be excluded and must be purchased separately.
Wildfire season runs from May through October, although the definition has become looser due to climate change contributing to wildfire conditions outside of those months.
Almost 85% of wildfires in the United States are started by humans through unattended campfires, debris burning, equipment use, discarded cigarettes, and arson.
Lightning is a leading natural cause of wildfires.
Sources
- Colorado Department of Regulatory Agencies - Division of Insurance (2023). "Homeowners' Insurance Availability Study."
- National Interagency Fire Center (2023). "National Interagency Coordination Center Wildland Fire Summary and Statistics Annual Report 2022."
- National Interagency Fire Center (2023). "Wildfires and Acres."
- Verisk. "Wildfire Risk Analysis."
Our Research Expert
Jack Caporal is the Research Director for The Motley Fool and The Motley Fool Ascent.
We're firm believers in the Golden Rule, which is why editorial opinions are ours alone and have not been previously reviewed, approved, or endorsed by included advertisers. The Ascent, a Motley Fool service, does not cover all offers on the market. The Ascent has a dedicated team of editors and analysts focused on personal finance, and they follow the same set of publishing standards and editorial integrity while maintaining professional separation from the analysts and editors on other Motley Fool brands.