
Shares of Tractor Supply Co. (TSCO +0.21%) hit a 52-week high last week. Let's look at what's behind this stock's recent movements to try to better understand what might happen in its future.
How it got here
Tractor Supply is just one of many farm-focused stocks that have done well over the past year. Machinery, seeds, fertilizer, and (in Tractor Supply's case) a little bit of everything else for down-on-the-farm productivity have posted strong gains in the past 52 weeks:

TSCO Total Return Price data by YCharts
I've already covered the 52-week highs of seed leader Monsanto (MON +0.00%) and top fertilizer performers Rentech Nitrogen Partners (NYSE: RNF) and CF Industries (CF +1.56%) this year. Only Deere (DE 2.54%) has failed to nudge past its prior 52-week high, and it's a more diversified enterprise, with exposure to sectors (such as construction) that demand strong economic growth to justify continued capital spending on heavy machinery.
Demand for farm products of all stripes can be tied to two important -- and interconnected -- trends: the price of many staple crops, and the potential yield of those crops from year to year. This year, farms across the American Corn Belt have suffered under withering drought conditions, forcing the price of the corn and soybeans that survived to all-time highs:
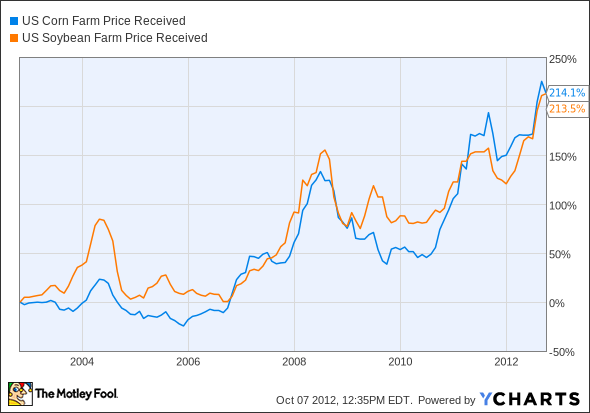
US Corn Farm Price Received data by YCharts
Desperate farmers will do whatever they can to produce the crops necessary to turn a profit, which brings more buyers to Tractor Supply and its farm-supply peers. But will a return to weather normalcy depress crop prices and dent farm-supply stocks? Let's look at how these companies stack up on a few key valuation metrics to find out how sustainable this recent strong growth might be.
What you need to know
The excitement around Tractor Supply has pushed it to the most exorbitant valuations of its peer group. The company does have the highest expected growth rate, but that alone may not justify its high P/E:
|
Company |
P/E Ratio |
Price to Levered Free Cash Flow |
Net Margin (TTM) |
Projected Growth Rate (2013) |
|---|---|---|---|---|
|
Tractor Supply |
28.9 |
56.6 |
5.7% |
16.7% |
|
Monsanto |
24.1 |
26.9 |
15.1% |
14.1% |
|
Rentech Nitrogen Partners |
18.2 |
NM |
34.0% |
(1.3%) |
|
CF Industries |
8.5 |
9.0 |
27.3% |
(8.2%) |
|
Deere |
11.1 |
NM |
8.7% |
6.3% |
Source: Yahoo! Finance. NM = not material due to negative (or no) results.
Tractor Supply rode multiple earnings beats to its current position, but along the way its P/E has increased dramatically. Much of the stock's price growth has been matched by a simultaneous rise in valuation:

TSCO Total Return Price data by YCharts
A big bottom-line uptick could make this look more reasonable, but the stock's P/E would likely remain well above earlier levels. Tractor Supply's full-year-profit forecast is barely above its trailing-12-month results.
What's next?
How long can a stock's valuation rise before market sentiment shifts? Tractor Supply isn't yet breaching heights that have left a number of former growth superstars gasping for air. However, there are very few stocks out there that can continue to reach higher P/Es for years without eventually stumbling back to a median.
The Motley Fool's CAPS community is positive on Tractor Supply. It's earned a three-star rating, with 89% of our CAPS players expecting the company to continue its outperformance. Interested in tracking this stock in the months and years ahead? Add Tractor Supply to your Watchlist now, for all the news we Fools can find, delivered to your inbox as it happens.


