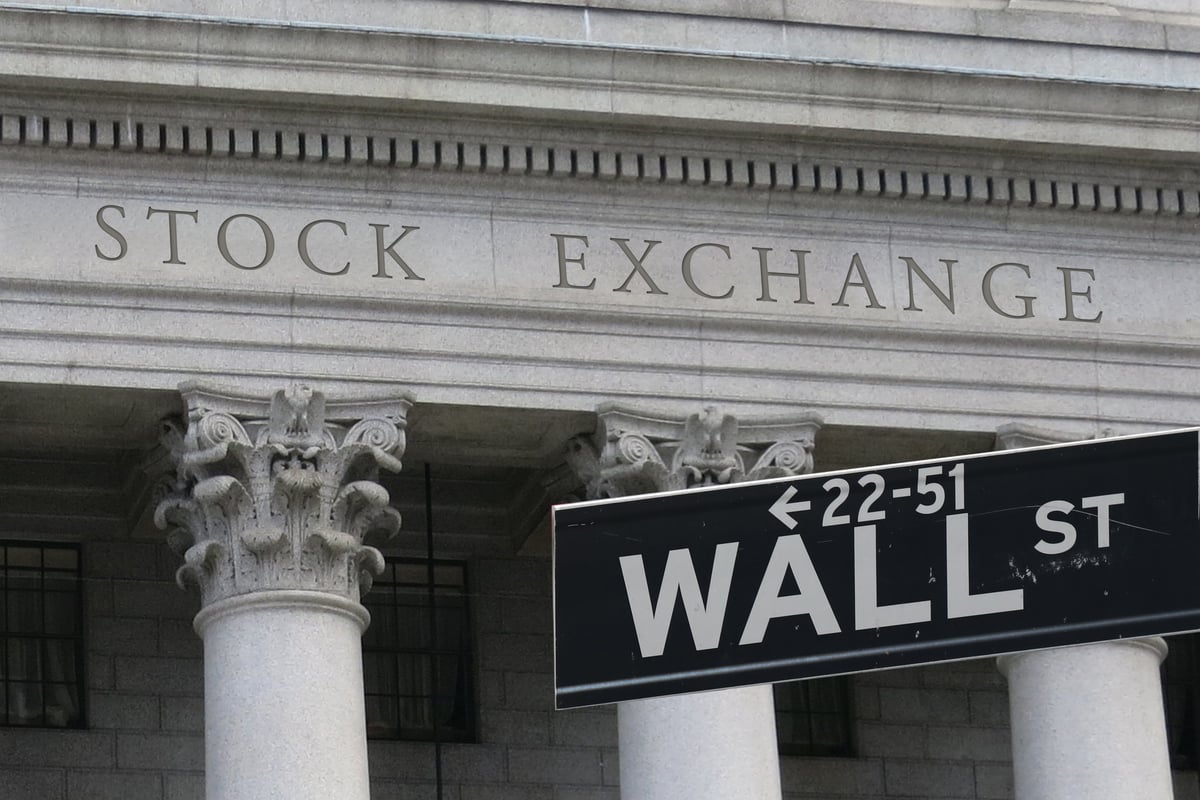
The Dow Jones Industrial Average (^DJI 0.34%) has been America's most-watched market index for decades, despite -- or perhaps because -- of its narrow focus on a mere 30 stocks. Where other indices might track 500, or 2,000, or even 5,000 different stocks, the Dow's steady focus on 30 business bellwethers has made it both easier to understand and easier to dismiss as a relic of simpler times. But as long as the Dow remains front and center in every day-to-day market analysis, it and its component companies will remain the most important barometers of American markets.

Source: Wikimedia Commons.
That's why it's important to understand not only the Dow, but its components as well. What do they do? What do they represent on the Dow, and why do they matter to the American economy? Where have they come from and where might they be heading in the future? Today we'll dig into the details of DuPont (DD +0.00%) to find answers to these questions and more, so that we can understand not just what moves the Dow, but why.
DuPont at a glance
- Founded: July 19, 1802 (it's the oldest company on the Dow).
- Joined the Dow: Nov. 20, 1935 (fourth-longest streak of all current components).
- Current Dow weighting: 2.6% (20th of 30 components).
- Replaced: Coca-Cola (KO +2.18%), which rejoined in 1987.
- Also a Dow component from: 1922 to 1923.
- Sector represented: Chemicals
- Rank (by revenue) among all chemical stocks:
- o 2nd (Fortune 500, chemicals)
- o 8th (IHS Chemical Week, global ranking by chemicals revenue)
- o 8th (ICIS, top 100 companies by chemicals revenue)
- o 9th (ACS, world's largest chemical companies)
DuPont has been around almost since the founding of the United States, and it has played an important role in American peace and war -- though mostly in war until the mid-20th century. DuPont was essentially a gunpowder monopolist for much of the 1800s, and although most its gunpowder holdings were forcibly divested by antitrust actions in the early 1900s, DuPont itself remained a hugely important ally of the American military through both World Wars. It retained the rights to sell gunpowder to the Allies in World War I, and later became a major chemical innovator in the 1930s and beyond, supporting a wide range of wartime needs while also developing products that would help transform the modern American lifestyle.
However, DuPont has since slipped from its dominant position atop the American chemicals industry, and it appears to have ceded its global leadership to a number of other companies, including some relatively recent entrants to the industry. DuPont isn't even America's largest chemicals company by revenue -- that crown goes to Dow Chemical (DOW +0.00%), which has never been part of the Dow Jones Industrial Average despite sharing its name. When the chemicals-sourced revenue of nonchemicals companies are tallied as well, DuPont falls to third place among all U.S. companies, as ExxonMobil (XOM +3.85%) recorded an estimated $60.9 billion in chemical sales in 2012, according to ICIS, more than even Dow Chemical. The oil and gas giant brought in much less chemicals revenue that year, according to the American Chemical Society, but it was still enough to top DuPont in the rankings among American companies.
In fact, Dow Chemical's trailing 12-month revenue is roughly 60% higher than DuPont's, and its trailing 12-month net income is over 75% higher than DuPont's today, as DuPont lost a significant amount of earnings this year from various divested and discontinued businesses that are no longer tallied. DuPont had historically boasted stronger earnings than Dow Chemical, but if this role reversal proves durable, the Dow index may be forced to consider ousting one of its longest-tenured components in favor of a company that better represents the American chemical industry. However, as we'll see below, it has been hard to keep DuPont down for long.
DuPont by the numbers
- Ten-year share price growth: 56.3%
- Ten-year dividend growth: 28.6%
- Total return (with dividends reinvested): 125.3%
- Average P/E over the past decade: 17.8
- Current P/E premium over average P/E: 21.9%
DD Revenue (TTM) data by YCharts.
- Annualized revenue growth (past five years): 4.9%
- Annualized EPS growth (past five years): 35.1%
- Annualized free cash flow growth (past five years): (3.1%)
- Change in profit margins (past five years): 259.5%
This last chart best shows why DuPont clings to its spot on the Dow -- it has done a phenomenal job at growing its bottom line, even as revenue grows tepidly at best and free cash flow falls. DuPont's earnings-per-share growth is impressive even on longer timelines, as its annualized growth rate for the past decade (remember that the recession ended about five years ago on many companies' income statements) is still a very impressive 13.4%.
This year, DuPont expects to continue its double-digit EPS growth, as its current guidance -- weak first quarter notwithstanding -- anticipates an improvement of roughly 12% over last year's result. Over the long term, DuPont plans to continue focusing on "feeding people, developing renewable energy sources, protecting the environment, and creating advanced materials for an increasingly urban world," which is expected to swell in population to 9 billion people by 2050, according to CEO Ellen Kullman's 2013 shareholder letter. Wall Street's analysts are somewhat more bearish over the long term, as they anticipate EPS growth of 8.2% annually through the next five years, compared to 14% growth per year for the rest of the chemicals industry. But as long as DuPont can continue silencing its doubters and innovating its way to new growth while remaining hugely profitable, it should remain atop the chemical industry as its lone Dow index representative for years to come.


