Since GDP is the broadest measure of economic activity, gross domestic product (GDP) is arguably second only to the monthly employment report in terms of the attention it commands from economists, investors, and the financial media. As such, it's worth knowing what the headline statistic — the annual growth rate in real GDP — represents. Let's take a closer look at how to calculate this rate.
First, what is gross domestic product?
Let's start with gross domestic product, or GDP, which measures the value of all final goods and services produced by labor and property in a well-defined geographical area. For example, you can produce GDP estimates for California, the European Union, or even the world.
In practice, the most widely reported GDP data are country-level data. GDP is considered the broadest indicator of a country's economic activity, and the task of measuring GDP usually falls on national statistics agencies.
The Bureau of Economic Analysis (BEA), part of the U.S. Department of Commerce, is responsible for producing official GDP data in the U.S. It reports the data quarterly. Although the GDP estimates undergo several revisions, the third estimate is considered final.
For more than you'll probably ever want to know about GDP and the seven NIPA (national income and product accounts), you can have a look at this 25-page GDP primer from the BEA.
Now, what is real GDP?
You may have heard economists or journalists refer to "real GDP," which refers to GDP estimates adjusted for inflation. Although politicians would be only too happy to make up their own GDP numbers, there is no such thing as an imaginary GDP.
Why adjust for inflation?
If we compared GDP for two periods measured on a nominal basis (referred to as "current dollar" GDP estimates), we'd expect GDP to increase over time simply by virtue of the general increases in the prices of goods and services.
However, we're really interested in discovering how economic activity is progressing over time. Stripping out the effect of inflation from current dollar GDP estimates to produce real (or "chained dollar") estimates gets us closer to that goal.
Why calculate a growth rate?
GDP figures from a single quarter are not that useful. Economists, capital markets professionals, and others like to track the growth rate in real GDP to get a sense of changes in economic activity. In fact, that's the single most important figure in the BEA's quarterly releases and the only one mentioned in the first paragraph of the release.
Unsurprisingly, when it comes to GDP data, it's also the most widely cited figure. When people in the financial services industry or the financial media refer to "the GDP number" or "the GDP print," they are referring to one thing: the annual growth rate in real GDP. It's very rare for anyone to mention the dollar amount of GDP.
How does one calculate the real GDP growth rate?
In the U.S., the growth rate the BEA reports is a quarter-on-quarter (QoQ) growth rate, which is the growth in real GDP from one quarter to the next, expressed as a percentage. The growth rate is expressed on an annual basis, so there are two steps to the calculation:
Step 1
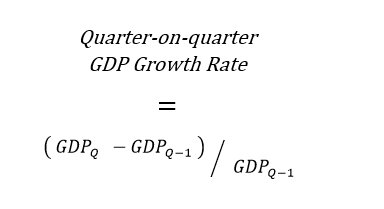
First, we find the quarterly growth rate in real GDP, which is a straightforward percentage calculation that relates the change in GDP during the most recent quarter to the level of GDP in the preceding quarter:
Quarter-on-quarter GDP Growth Rate = (GDPₓ – GDPₓ₋₁) ÷ GDPₓ₋₁
Step 2
Let's refer to the rate we obtained in step 1 as g(quarterly) (sort of like the men's magazine). Remember, it's a quarterly rate, and we're looking for an annual rate, so we annualize it using the following formula:
g₍annual₎ = (1 + g₍quarterly₎)⁴ – 1

The annual rate is equivalent to the growth rate over a year if GDP keeps growing at the same quarterly rate for three more quarters (or the same average rate).
Calculating the real GDP growth rate -- a worked example
Let's work through an example using actual GDP data (from 2015). You can download the most recent data as an Excel spreadsheet from the BEA website (found here — click on "Tables Only" in the "Current Release" box). Highlighted are the two figures we'll need for our calculation — the GDP figures for the first and second quarters.

Applying the formula from Step 1, the QoQ real GDP growth rate during the second quarter is equal to:
(16,324.3 - 16,177.3) / 16,177.3 = .0091 = 0.91% (quarterly rate)
Next, we apply the formula from Step 2 to find the annual rate:
(( 1 + .0091 ) ^ 4)-1 = .0369 = 3.69% (annual rate)
Rounding to a single decimal, we get an annual GDP growth rate of 3.7%.
If our math is correct, that number ought to match up with the one reported in the BEA's press release:

Success!
QoQ growth rates: No seasoning, please!
Technically, the rate we have just calculated is referred to as the QoQ seasonally adjusted annual rate (or QoQ SAAR) because official statistical organizations use seasonally adjusted GDP estimates in their calculations. Seasonal adjustments attempt to neutralize the effect of changes in GDP that are purely the result of recurring seasonal activity to arrive at data that gives a better picture of the economy and its cyclicality.
According to the BEA, "[E]xamples of factors that may influence seasonal patterns include weather, holidays, and production schedules."
Here's an example of a seasonal factor: People join gyms en masse in January on the strength of their New Year's resolutions. Does this mean the fitness industry has exploded since the previous month? Of course not.
To answer whether activity in the industry has improved or deteriorated, your instinct would probably be to compare January's results with those achieved during the previous January. Good instinct! Logically, corresponding quarters don't require seasonal adjustments -- one of the advantages of a second method for calculating the annual growth rate in GDP.
Is there a second method to calculate a GDP growth rate?
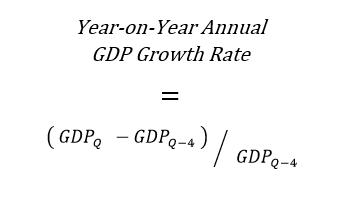
Yes. Instead of annualizing a quarterly rate, it's possible to calculate the year-on-year (YoY) annual rate, which is the percentage change in real GDP between a given quarter and the same quarter in the previous year (e.g., the second quarter of 2015 versus the second quarter of 2014).
Using the same notation as previously:
As mentioned, that's not how the government reports GDP growth in the U.S., but China's widely followed headline GDP growth rate is a YoY annual rate:

How do the two calculation methods compare?
Over time, the YoY rate is much less volatile than the QoQ rate and is subject to smaller revisions. When you look at a graph of the QoQ rate, it's difficult to make out a trend. And because it compares corresponding quarters, the YoY rate is not dependent on the methodology for seasonal adjustments that is necessary for comparing consecutive quarters.
National statistics offices do not follow a uniform methodology for making seasonal adjustments, so YoY rates are better suited for international comparisons. The main advantage of using a QoQ growth rate is that it's easier to identify turning points in the economy, such as the end of a recession or the beginning of an expansionary period.
The following graph shows both growth rates for 2005 through 2014. You can see where the YoY rate (red line) bottomed out during the Great Recession of 2008-2009. Meanwhile, the QoQ rate had already rebounded sharply and was close to flat, suggesting the recession was almost over:

Both methods have strengths and weaknesses, although economists generally prefer the YoY rate. The good news is that any statistical agency worth its salt will publish both rates. However, even if they don't, you now have the tools necessary to calculate them on your own using GDP figures. But make sure to select the right ones: Seasonally and inflation-adjusted data should be your mantra.
Related investing topics
Once you've seen how economies are doing on the whole, you may want to start betting on individual parts of them (i.e., companies. If you're thinking it's time to start buying stocks, consider taking a look at our broker center to find good advice on how to begin.


