Accessibility Menu
Titan Machinery logo

Titan Machinery

(NASDAQ) TITN

Current Price$19.18
Market Cap$446.00MMarket cap calculated using publicly traded shares outstanding only. Does not include unlisted, private, or dual-class non-traded shares. Implied market cap may vary.
Since IPO (2007)+102%
5 Year-31%
1 Year-3%
1 Month-1%
Titan Machinery last closing stock price
MetricPriceDate
Last closeUSD 19.142026-07-17
Titan Machinery stock price return by period
PeriodPrice returnPrice at period startPeriod start date
1 week+4.76%USD 18.272026-07-10
1 month-1.39%USD 19.412026-06-17
3 month-5.95%USD 20.352026-04-17
Year to date+27.26%USD 15.042025-12-31
1 year-2.5%USD 19.632025-07-17
3 year-40.41%USD 32.122023-07-18
5 year-31.08%USD 27.772021-07-16
Since inception+101.9%USD 9.482007-12-06

Titan Machinery Financials at a Glance

Market Cap

$446.00MMarket cap calculated using publicly traded shares outstanding only. Does not include unlisted, private, or dual-class non-traded shares. Implied market cap may vary.

Revenue (TTM)

$2.36B

Net Income (TTM)

-$53.59M

EPS (TTM)

-$2.35

P/E Ratio

-8.14

Dividend

$0.00

Beta (Volatility)

1.24 (Average)

Price

$19.18

Volume

135,998.115

Open

$18.77

Previous Close

$19.14

Daily Range

$18.75 - $19.48

52-Week Range

$13.21 - $25.00

Estimated Earnings Date

Aug 27, 2026

TITN: Motley Fool Moneyball Superscore

43

Our CEO Is Handing Members His Secret Weapon

It's called Motley Fool Moneyball, our new proprietary AI tool

We spent over half a million dollars in R&D to build a tool that makes stock research faster, sharper, and smarter. Our analysts use it every day, and now, you can too.

Get Access Now

About Titan Machinery

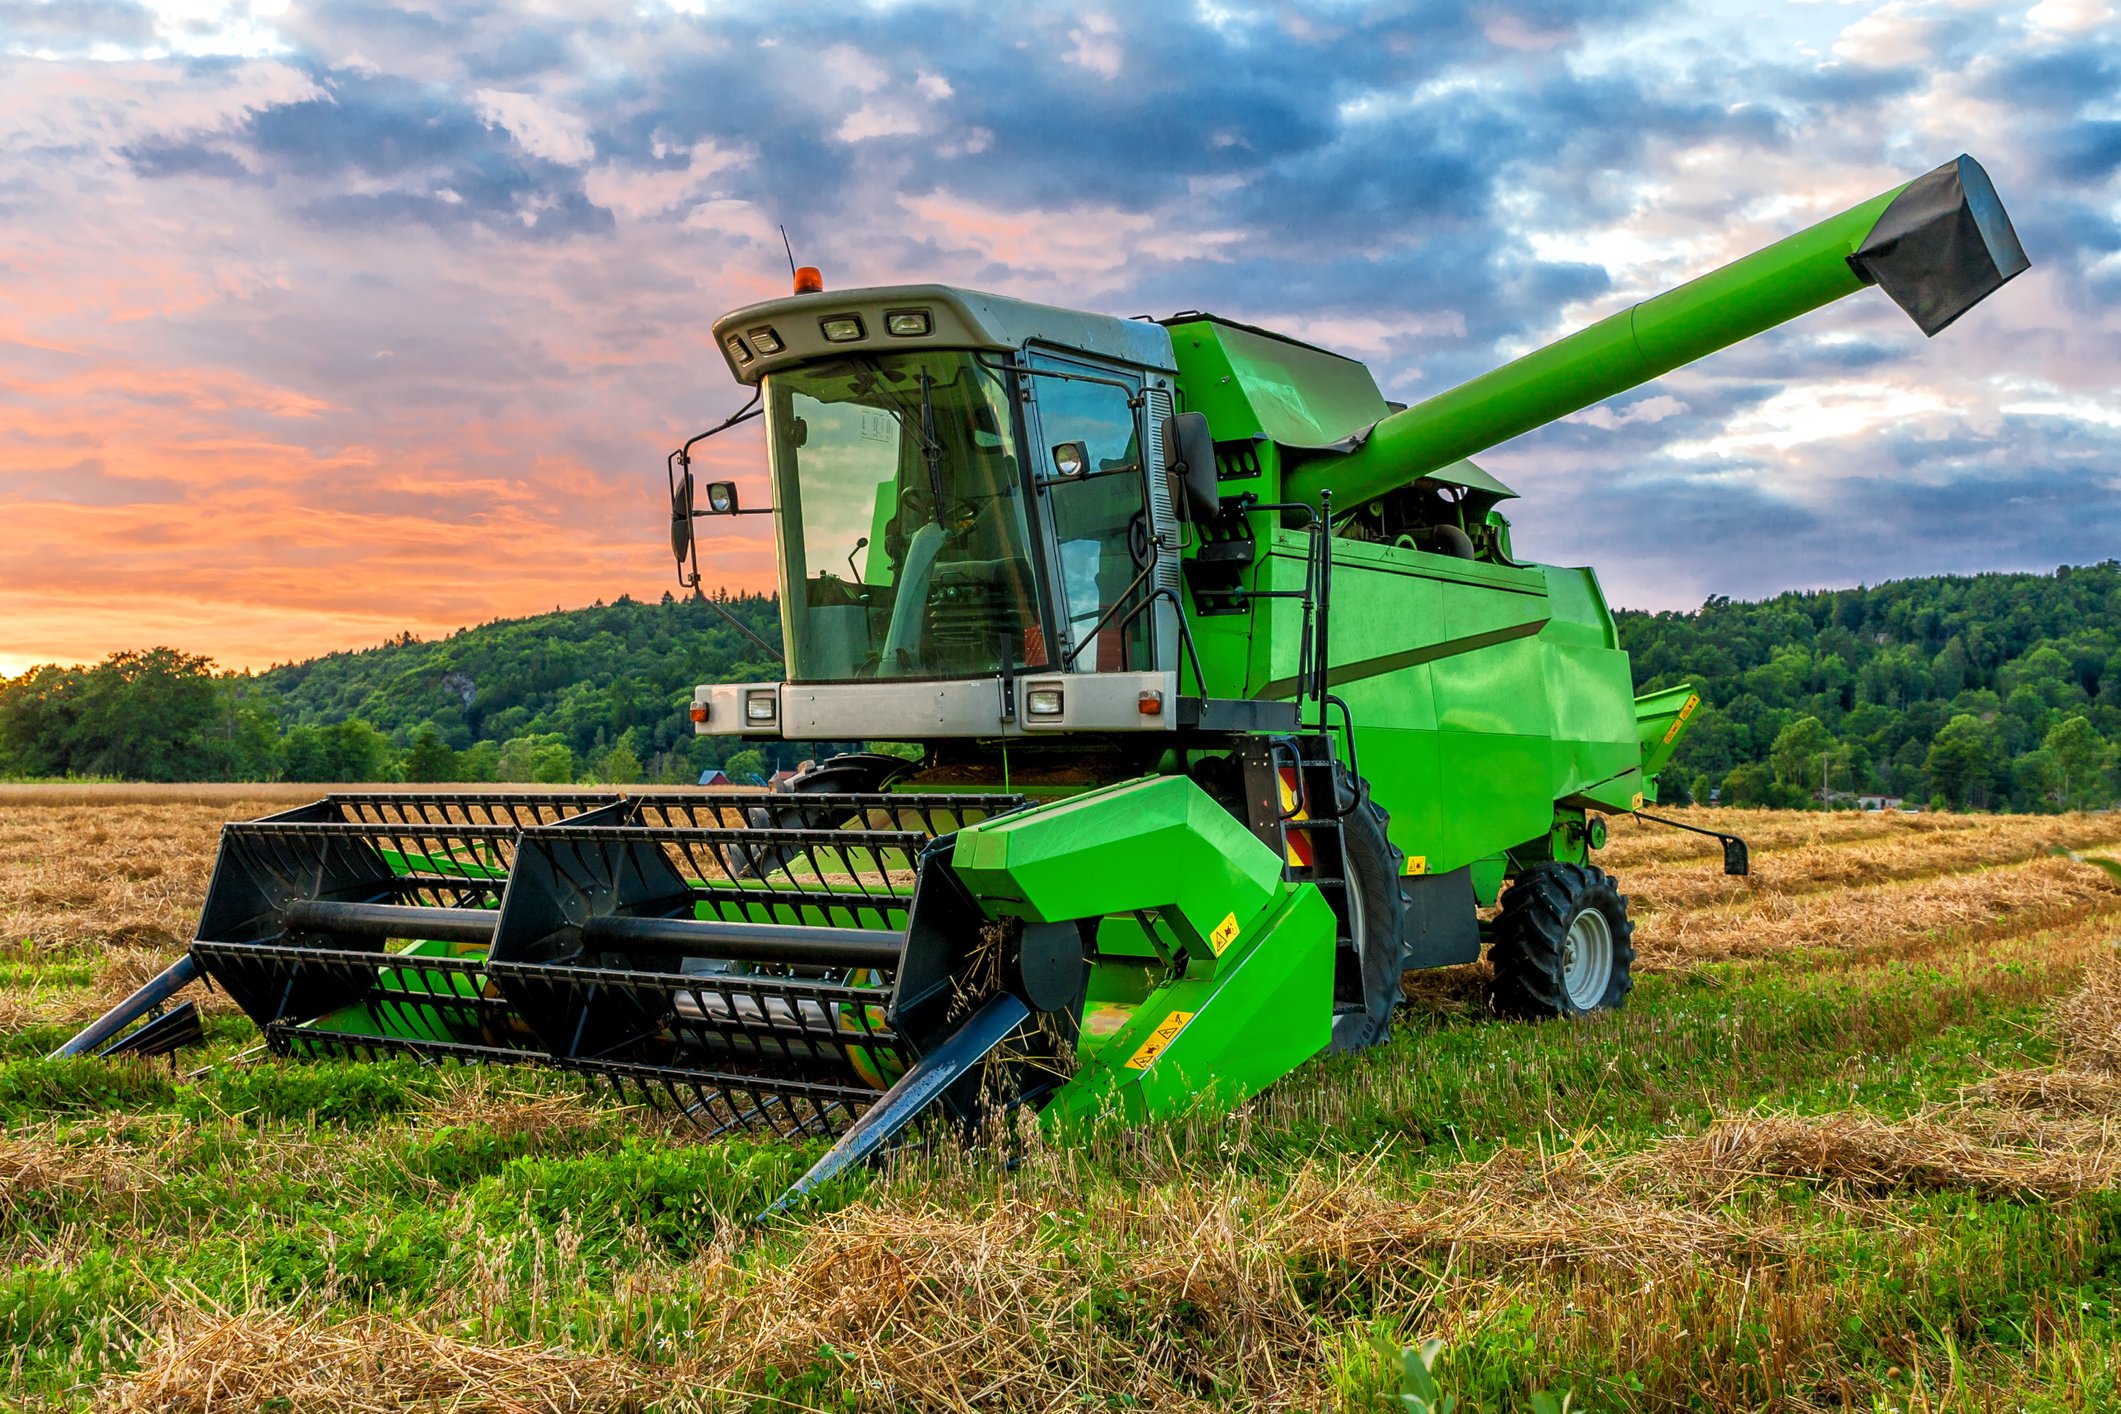
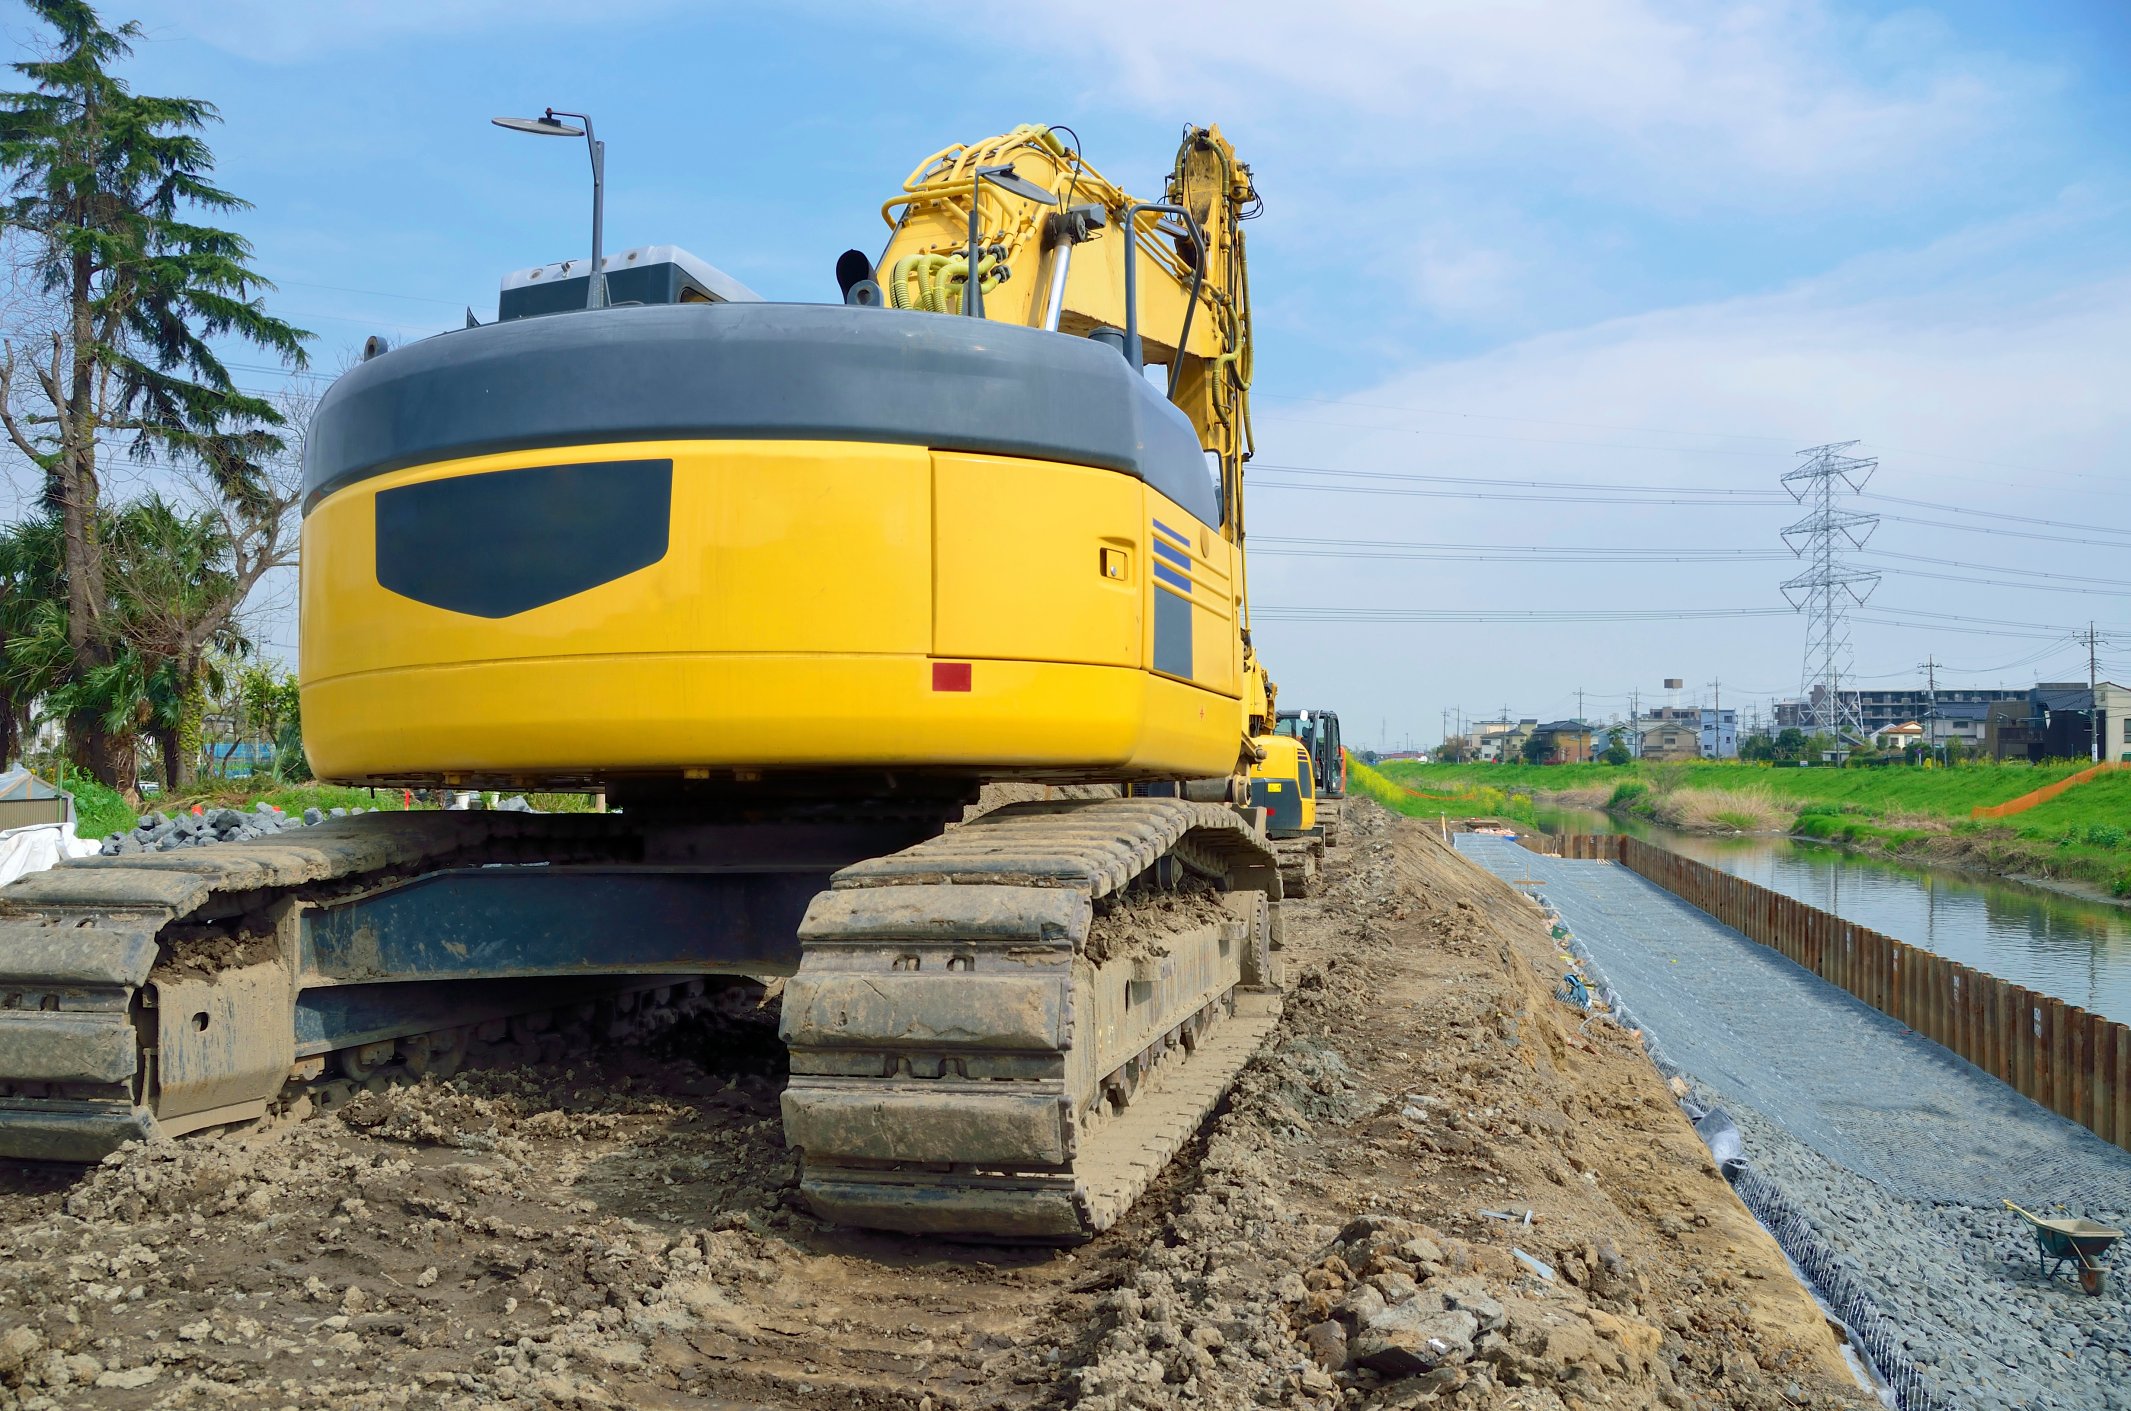
Titan Machinery sells and fixes big farming and building machines. It helps farmers grow food and builders finish large projects. The company operates stores in America, Europe, and Australia.

How Titan Serves Its Customers

  • Agriculture Equipment: Machinery and tools for growing food and renewable energy; generated $344 million in revenue in Q1 2027.
  • Construction Machinery: Heavy and light equipment for building roads and homes; produced $67 million in revenue in Q1 2027.
  • Parts and Service: Replacement components and maintenance for all machine types; accounted for $104 million and $44 million in revenue respectively.
  • International Operations: Sales and support in Europe and Australia; provided $60 million and $50 million in revenue in Q1 2027.
  • Equipment Rental: Short-term machinery use for builders and industrial crews; primarily served through the construction segment.

Expansion Across the Globe

  • Acquired Farmers Implement and Irrigation, Inc. on May 15, 2025, adding an agriculture dealership in South Dakota.
  • Purchased Bellevue Machinery on October 1, 2025, to grow the company footprint in Victoria, Australia.
  • Divested CNH Industrial distribution rights in Germany in November 2025 to focus on higher-return markets.

Two Strengths of the Business

Titan Machinery is the largest retail dealer for CaseIH Agriculture equipment in the world and a major partner for the CNH Industrial brand family. The company uses parts and service profits to pay for business costs during cycles when equipment sales are low.

A Look at Recent Financials

  • Revenue reached $522 million in Q1 2027, down 12.1% from the first quarter of 2026.
  • Net loss narrowed to $12.6 million in Q1 2027, which was a 4.5% improvement from the previous year.
  • Gross profit margin rose to 17.1% in Q1 2027, up from 15.3% in the same period of 2026.
  • Free cash flow hit negative $25.6 million in Q1 2027, which deepened from negative $1.8 million in 2026.

Bottom Line

Titan Machinery has evolved from a regional retailer into a global equipment network across three continents. The company balances fluctuating machinery demand by focusing on higher-margin repair parts and maintenance services.

AI Generated • Jun 10, 2026

Industry

Trading Companies and Distributors

Employees

3,114

CEO

Bryan J. Knutson

Headquarters

West Fargo, ND 58078-2648, US

TITN Financials

Key Financial Metrics (TTM)

Gross Margin

16.17%

Operating Margin

-0.11%

Net Income Margin

-2.28%

Return on Equity

-9.05%

Return on Capital

-0.19%

Return on Assets

-3.32%

Earnings Yield

-12.29%

Dividend Yield

0.00%

Payout Ratio

0.00%

Stock Overview

Market Cap

$446.00MMarket cap calculated using publicly traded shares outstanding only. Does not include unlisted, private, or dual-class non-traded shares. Implied market cap may vary.

Shares Outstanding

23.30M

Volume

136.00K

Avg. Volume

187.91K

Financials (TTM)

Gross Profit

$380.90M

Operating Income

-$2.63M

EBITDA

$36.48M

Operating Cash Flow

$108.17M

Capital Expenditure

-$16.91M

Free Cash Flow

$91.25M

Cash & ST Invst.

$29.58M

Total Debt

$858.32M

Titan Machinery Performance Analysis

Titan Machinery annual revenue and year-over-year revenue growth by fiscal year
Fiscal yearPeriod endRevenueYoY growth
20232023-01-31USD 2,209,306,00029.1%
20242024-01-31USD 2,758,445,00024.9%
20252025-01-31USD 2,702,122,000-2.0%
20262026-01-31USD 2,427,107,000-10.2%
Titan Machinery sequential (quarter-over-quarter) revenue growth by fiscal quarter
Fiscal quarterPeriod endQoQ growth
Q22025-07-31-8.1%
Q32025-10-3118.0%
Q42026-01-31-0.4%
Q12026-04-30-18.6%
Titan Machinery annual diluted earnings per share and year-over-year EPS growth by fiscal year
Fiscal yearPeriod endDiluted EPSYoY growth
20232023-01-31USD 4.4953.6%
20242024-01-31USD 4.939.7%
20252025-01-31USD -1.63N/A
20262026-01-31USD -2.3845.9%
Titan Machinery sequential (quarter-over-quarter) diluted earnings per share growth by fiscal quarter
Fiscal quarterPeriod endQoQ growth
Q22025-07-3155.2%
Q32025-10-31119.7%
Q42026-01-31-3205.5%
Q12026-04-3065.4%

Revenue Growth Rate

Annual and quarterly growth comparison

Earnings Per Share Growth Rate

Annual and quarterly EPS growth comparison

Quarterly Performance

Name
Q1 2027YOY CHG

Revenue

$522.38M

-12.1%

Gross Profit

$89.28M

-1.8%

Gross Margin

17.09%

N/A

Market Cap

$446.00MMarket cap calculated using publicly traded shares outstanding only. Does not include unlisted, private, or dual-class non-traded shares. Implied market cap may vary.

N/A

Market Cap/Employee

$143.23K

N/A

Employees

3,114

N/A

Net Income

-$12.62M

+4.5%

EBITDA

$3.93M

+23.6%

Quarterly Fundamentals

Name
Q1 2027YOY CHG

Total Cash

$29.58M

+37.5%

Total Debt

$858.32M

-15.2%

Accounts Receivable

$109.58M

-11.6%

Inventory

$914.83M

-16.8%

Long Term Debt

$239.10M

+6.4%

Short Term Debt

$619.22M

-21.3%

Return on Assets

-3.32%

N/A

Return on Invested Capital

-0.32%

N/A

Free Cash Flow

-$25.64M

-1329.8%

Operating Cash Flow

-$23.09M

-472.8%

Other Investments to Explore

People Also Watch

Symbol / CompanyPricePrice Chg
LXFRLuxfer Holdings PLC
$16.51-3.73%
CMDBCostamare Bulkers Holdings Limited
$18.81-4.37%
MAGNMagnera Corp
$13.61-2.92%
WNCWabash National Corporation
$13.44+7.18%

Trending Stocks

Symbol / CompanyPricePrice Chg
NFLXNetflix
$68.95-0.07%
PATHUiPath
$12.15+0.01%
SOFISoFi Technologies
$17.28-0.00%
SPCXSpace Exploration Technologies
$123.99-0.05%

Questions About TITN

What is the current price of Titan Machinery?

Titan Machinery is trading at $19.14 per share.

What is the 52-week range for Titan Machinery?

Over the past 52 weeks, Titan Machinery has traded between $13.21 and $25.00.

How much debt does Titan Machinery have?

As of the most recent reporting period, Titan Machinery reported total debt of $858.32M.

How much cash does Titan Machinery have on hand?

Titan Machinery reported $29.58M in cash and cash equivalents in its most recent financial results.

What is Titan Machinery’s dividend yield?

Titan Machinery does not currently have a dividend yield.

Premium Investing Services

Invest better with The Motley Fool. Get stock recommendations, portfolio guidance, and more from The Motley Fool's premium services.