The 2021 Housing Market: 89% of Properties Sell in a Month
"Blazing," "scorching," "on fire," "red-hot." Those are just a few of the ways the housing market has been described over the last year. And rightfully so -- residential real estate prices are at record highs and have risen at a record pace, housing inventory remains low, and the 30-year fixed mortgage rate is still at an attractive level for homebuyers.
We decided to take a deeper look to get a better picture of how this housing market compares to recent years.
We found that most housing market metrics are at all-time levels, pointing to a seller's market. Houses are selling faster than ever, with more offers and a higher percentage of them being made above the list price.
Read on for a deep dive into just how hot the housing market really is.
Key findings
- 89% of residential properties sold in under a month in June 2021, compared to 56% in June 2019.
- Homes spent an average of 17 days on the market in June, 10 days fewer than two years ago.
- Sellers had an average of four offers on their homes, roughly double the number from two years ago.
- Homes in Utah, Washington, Arizona, Georgia, and New Hampshire are getting the most offers.
- 55% of bid offers were made above the list price in June.
- New home sales have more than doubled and new home construction has gone up 2.5x since 2011.
89% of residential properties were sold in less than a month in June, compared to 56% in June 2019
89% of residential properties sold in less than a month in June 2021, compared to 56% in June 2019.
That number has been on the rise since the start of 2020 and saw its largest jump between February and March 2021.
That nearly 9 in 10 houses are being bought within a month of being on the market is a clear indication that demand in the housing market is historically high. The fact that that number has stayed relatively stable shows that this isn't just a blip, either.
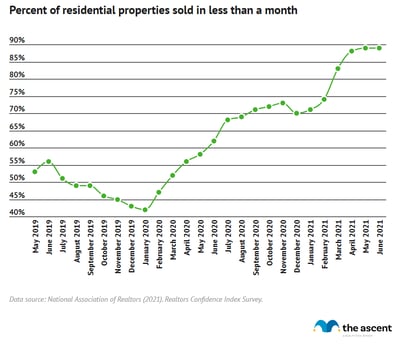
The data above shows a consistent rise in the percentage of homes that sold in one month or less since January 2020, when 42% did so. While this number held near 70% for a few months at the end of 2020, it quickly shot up to 88% in April 2021 and has been at 89% since May.
Homes spent 17 days on the market in June 2021, 10 days fewer than two years ago
Another indication that the housing market is sweltering is that homes spent, on average, 17 days on the market in June 2021, compared to 27 days in June 2019.
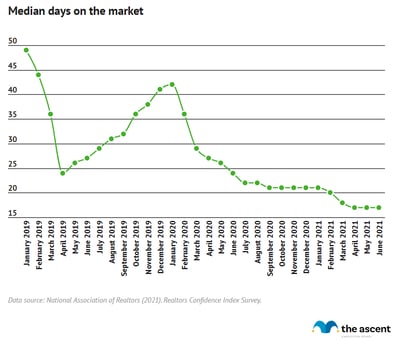
The average number of days a house spends on the market has been in decline since January 2020, when a house spent on average 42 days on the market. That 25-day drop over 18 months is another sign that the housing market has been through and remains in new territory.
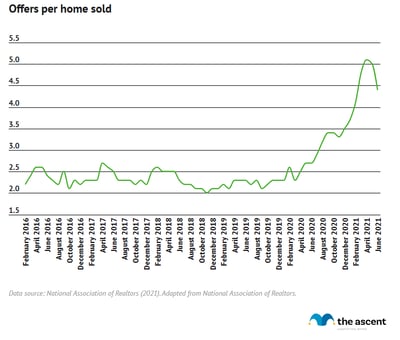
4 offers per home were made in June, roughly double from two years ago
Another sign of unprecedented demand in the housing market is the fact that homes are averaging over four offers before being sold, about double the number received two years ago.
Average offers per home sold peaked at 5.1 in April, up from around 2 offers per home sold that was the standard prior to January 2020.
This data again reflects high demand from homebuyers paired with low supply. Given the raft of media stories over the past year about bidding wars, we weren’t surprised by the steady rise in offers per home sold.
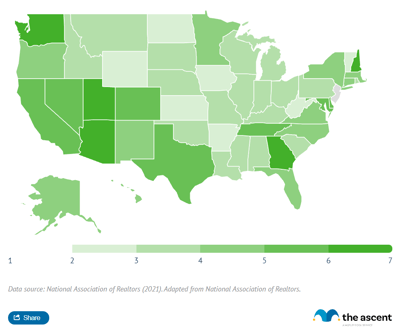
Homes in Utah, Washington, Arizona, Georgia, and New Hampshire received the most offers
Between January and March, homes sold in Utah averaged 7 offers, and homes in Washington, Arizona, Georgia, and New Hampshire received 6 offers on average. California, Colorado, Texas, Tennessee, New Jersey, Delaware, and Maryland also beat the national average for those months with five offers per home sold.
Of course, the temperature of the housing market isn’t the same across the entire country. Eight states averaged two or fewer offers per home sold: Montana, Wyoming, Kansas, North Dakota, Iowa, Arkansas, Vermont, and Maine.
Those states likely see lower offers per house sold for a variety of reasons. Population and economic output may be two fundamental reasons -- those eight states rank relatively low in both categories.
28% of homebuyers waived appraisal contingencies, 25% waived inspection contingencies
Another sign that homebuyers are interested in closing on a home quickly is the fact that 78% of home buyers waived a contingency in May. 28% waived their appraisal contingency and 25% waived their inspection contingency.
Those contingencies -- which can be included in an offer to buy a home -- allow a buyer to back out of a deal under certain conditions. In essence, they are protections for the homebuyer and lender.
Waiving those contingencies, while generally not advisable, can make an offer more appealing to a seller, especially when multiple similar bids are on the table, because it eliminates hoops for them to jump through before selling the home and leaves fewer outs for the homebuyer.
| Type of contingency | Percentage of waived contingencies |
|---|---|
| Appraisal contingency | 28% |
| Inspection contingency | 25% |
| No contingency waived | 22% |
| Financial contingency | 11% |
| Home sale contingency | 9% |
| Title contingency | 2% |
| Other | 2% |
55% of bid offers were made above the list price in June
Houses aren’t just flying off the market with record numbers of bids -- 55% of bids are above list price, according to the National Association of Realtors, and almost half of all homes are selling at above their listing price, per data from Redfin.
In mid-May 2021, 49.7% of homes sold above their listing price, compared to about 25% at the same time in 2020 and 2019, the Redfin data shows.
Home prices grew 21% from June 2020 to June 2021
On top of the speed at which houses are coming off the market and bidding wars driving up sales prices, average sales prices have risen by 21% over the past year, from $294,400 in June 2020 to $363,300 in June 2021.
Accordingly, the S&P/Case-Shiller U.S. National Home Price Index, which tracks residential real estate values, has risen by at least 10% year-over-year since January.
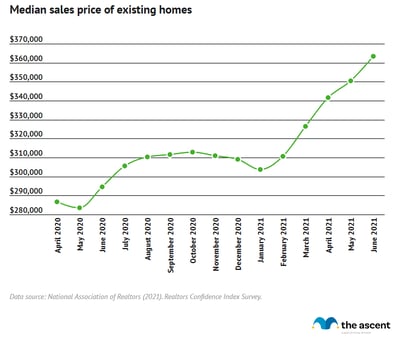
| Month | Median sales price of existing homes |
|---|---|
| June 2021 | $363,300 |
| May 2021 | $350,300 |
| April 2021 | $341,600 |
| March 2021 | $326,300 |
| February 2021 | $310,700 |
| January 2021 | $303,600 |
| December 2020 | $309,200 |
| November 2020 | $310,800 |
| October 2020 | $313,000 |
| September 2020 | $311,500 |
| August 2020 | $310,400 |
| July 2020 | $305,600 |
| June 2020 | $294,400 |
| May 2020 | $283,500 |
| April 2020 | $286,800 |
In the first five months of 2021, 22.4% of buyers of existing homes made an all-cash purchase
The rate of all-cash purchases is also up 2.7% from 2019, with 22.4% of homebuyers making their purchase with all cash and no financing in the first five months of 2021.
All-cash purchases are more attractive to sellers. They usually result in faster closing times and carry less risk than offers that are contingent on financing, so it’s no surprise they’re a bit more popular, despite elevated home prices.
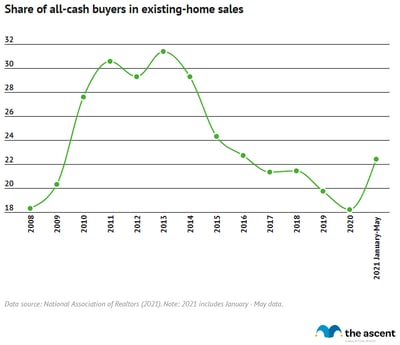
| Year | Share of all-cash buyers in existing-home sales |
|---|---|
| 2021 | 22.40% |
| 2020 | 18.20% |
| 2019 | 19.70% |
| 2018 | 21.40% |
| 2017 | 21.30% |
| 2016 | 22.70% |
| 2015 | 24.30% |
| 2014 | 29.30% |
| 2013 | 31.40% |
| 2012 | 29.30% |
| 2011 | 30.55 |
| 2010 | 27.60% |
| 2009 | 20.30% |
| 2008 | 18.30% |
Despite an uptick in 2021, though, we're still not seeing the levels of all-cash offers in 2011 or 2013, when the number was over 30%.
New home sales more than doubled since 2011
Given that houses are being bought and sold at a record pace for record prices, it shouldn’t be a surprise that new home sales have more than doubled over the past decade, with 769,000 home sales in May 2021 compared to 305,000 in May 2011.
New home sales peaked in January at 993,000 after staying in the 900,000-per-month range from July 2020 through January 2021, with November 2020 being the only exception.
The pace of new home sales picked up considerably starting in May 2020, after a slight dip in March and April, perhaps because families eyed more comfortable lodging as the pandemic reshaped daily life.
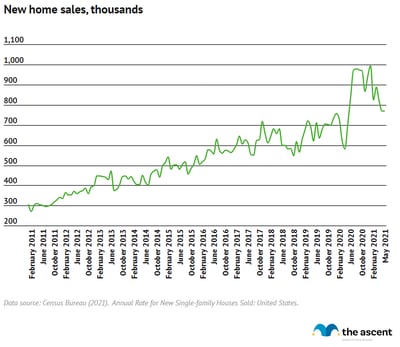
While new home sales have been on the rise since January 2011, when 307,000 were sold, we saw a big dip early in 2020, when sales went from 756,000 in January to 582,000 in April. The next months saw record-setting jumps to 977,000 in July 2020. Although the number has come down, they're still higher than they were at the beginning of 2020.
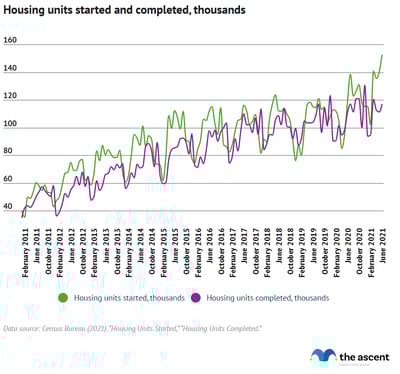
New home construction has increased 2.5 times since 2011
Home construction has followed a similar pattern, with 152,600 housing units started in June 2021 and 116,900 finished that month, compared to 60,500 started and 50,500 finished in June 2001.
As with sales, a steep drop in construction starts and finishes occurred in April and May 2020 when initial widespread disruptions from the pandemic were first felt in the United States.
Despite record-setting construction rates, housing supply remains depressed, with 2.6 months of supply estimated for June compared to 3.9 months of supply on average in 2019. Supply that low tilts the market towards sellers. A four- or five-month supply generally creates an equal housing market. More supply reduces cost pressure and gives buyers more options to choose from, creating a less cutthroat market.
One of the hottest housing markets in recent memory
The housing market is undoubtedly scorching now, and by many metrics has been for about a year.
What do these data points mean if you’re in the market for a house?
Low mortgage rates could be extremely attractive -- if you’re willing to brave a fast-moving seller's market characterized by bidding wars, low inventory, and limited options.
The Ascent has tools to help, from the best mortgage lenders chosen by our analysts to calculators, a mortgage pre-approval guide, and tips and advice for first-time homebuyers.
Sources
- Census Bureau (2021). "Annual Rate for New Single-family Houses Sold: United States."
- Census Bureau (2021). "Housing Units Completed."
- Census Bureau (2021). "Housing Units Started."
- National Association of Realtors, (2021). "2021 Home Buyers and Sellers Generational Trends Report."
- National Association of Realtors, (2021). "How are Buyers Coping in a Highly Competitive Housing Market?"
- National Association of Realtors, (2021). "May 2021 Existing-Home Sales Down for Fourth Straight Month as Home Prices Hit Historic High."
- National Association of Realtors, (2021). "More Homebuyers Making 20% Down Payments and Waiving Appraisal and Inspection Contract Contingencies."
- National Association of Realtors, (2021). "Realtors Confidence Index Survey, May 2021."
- Redfin, (2021). "Housing Market Update: Half of Homes Are Now Selling Above List Price."
- S&P Dow Jones Indices (2021). "S&P/Case-Shiller U.S. National Home Price Index."
Our Research Expert
Jack Caporal is the Research Director for The Motley Fool and The Motley Fool Ascent.
We're firm believers in the Golden Rule, which is why editorial opinions are ours alone and have not been previously reviewed, approved, or endorsed by included advertisers. The Ascent, a Motley Fool service, does not cover all offers on the market. The Ascent has a dedicated team of editors and analysts focused on personal finance, and they follow the same set of publishing standards and editorial integrity while maintaining professional separation from the analysts and editors on other Motley Fool brands. The Motley Fool has a Disclosure Policy. The Author and/or The Motley Fool may have an interest in companies mentioned.