A stock's historical variance measures the difference between the stock's returns for different periods and its average return. A stock with a lower variance typically generates returns that are closer to its average. A stock with a higher variance can generate returns that are much higher or lower than expected, which increases uncertainty and increases the risk of losing money.
Let's go over how to calculate the historical variance of stock returns as we work through an example step by step.

Step 1: Select the period and measurement period over which you wish to calculate the variance
There are two things you need to determine before you start the calculation:
- What is your time unit: daily, monthly, or annual returns?
- You're calculating historical variance. What is your "history" -- i.e., what is the time period for which you want to calculate the variance: 30 days, six months, 30 years, and so on?
The choice of time unit and your measurement period will depend on your goal in calculating the variance in the first place.
Discussing these choices is well beyond the scope of this article, so for the purpose of the following example, we'll start with our data set as a given. We'll calculate the historical monthly variance of the S&P 500 Total Return index over a five-year period from August 2010 through July 2015 -- that's 60 observations (5 years x 12 months).
Here's the formula for variance:
σ²ₕ = [ Σ (Rₜ – R̄)² ] / (n – 1)
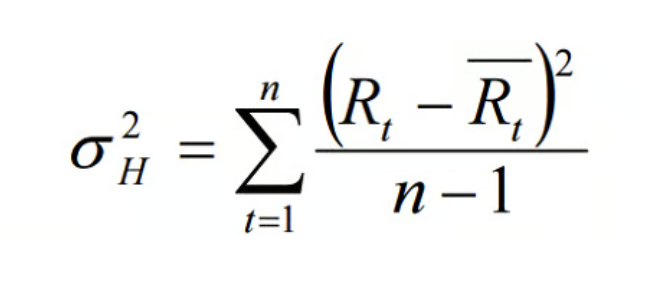
Wow, that looks really complicated. Let's start with a translation in English: The variance of historical returns is equal to the sum of squared deviations of returns from the average (R) divided by the number of observations (n) minus 1. (The large Greek letter sigma is the mathematical notation for a sum.)
That still sounds very complicated, which is why we're going to work through an example, and because no one in this day and age would calculate a variance by hand, we'll use Microsoft Excel.
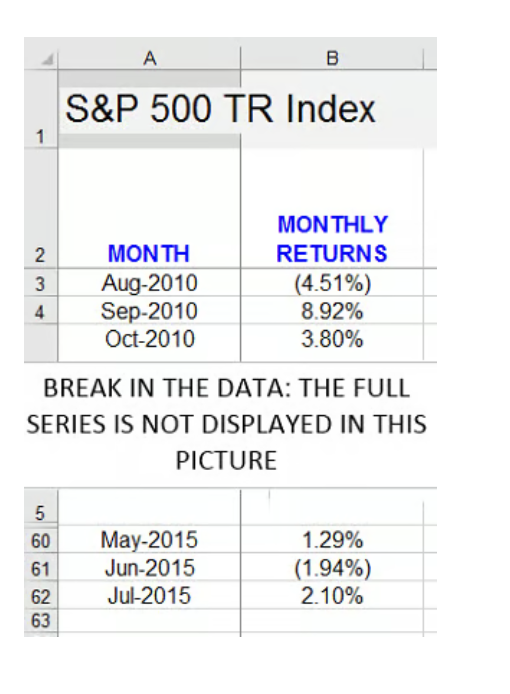
The following screenshot of our Excel spreadsheet shows our starting data set. Column B, from Rows 3 through 62, contains our monthly return series for the S&P 500 Total Return Index for the period from August 2010 through July 2015:
Step 2: Calculate the average return
The first thing we need to do is calculate the average return over the period. Mathematically, the formula for the average return is as follows:
Average return = (1 / n) x (sum of all the returns in the observation period)
Here, n is the total number of observations.
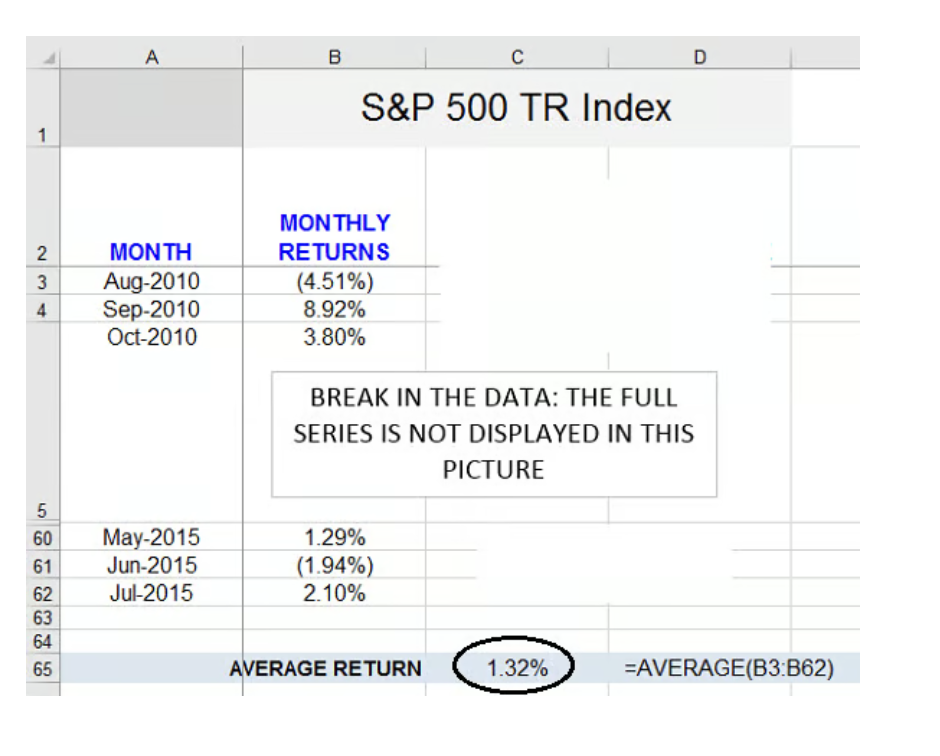
We calculate the average using Excel's "Average" function. The result, 1.32%, is in cell C65. (The exact Excel formula we use is displayed in the cell immediately to the right.)
Step 3: Calculate the difference between each of the individual returns and the average return
This step occurs in column C:
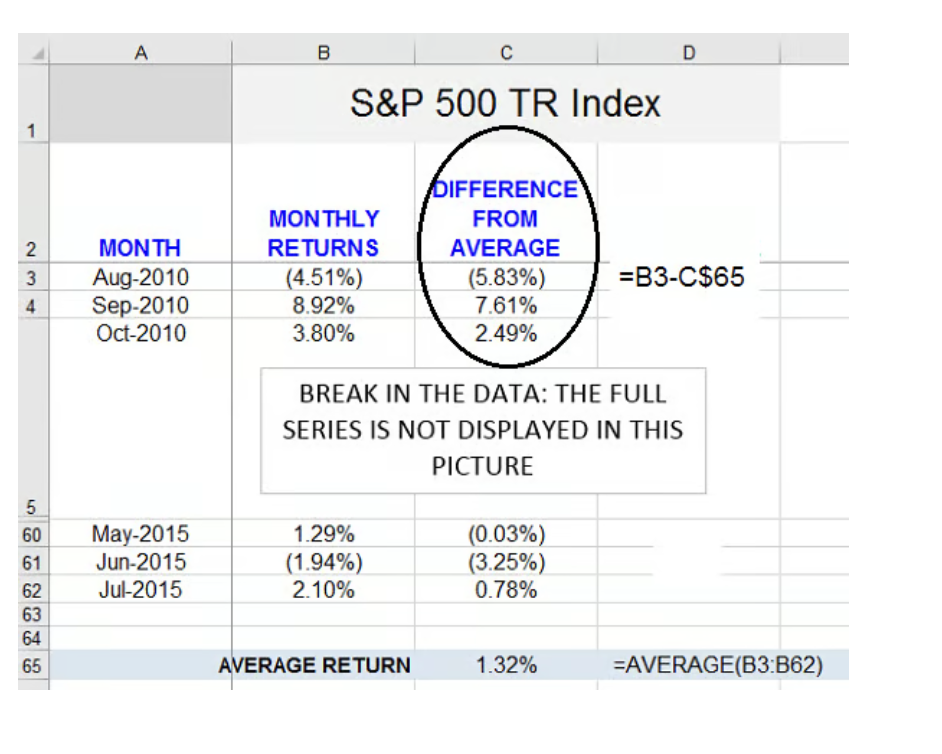
For example, for August 2010 (row 3), the difference between the monthly return is -4.51% - 1.32% = -5.83%, which is the figure found in Cell C3. (The Excel formula we used to obtain that figure is shown immediately to the right.)
Step 4: Calculate the square of the differences and add them all up
In column D, we square the differences we just obtained:
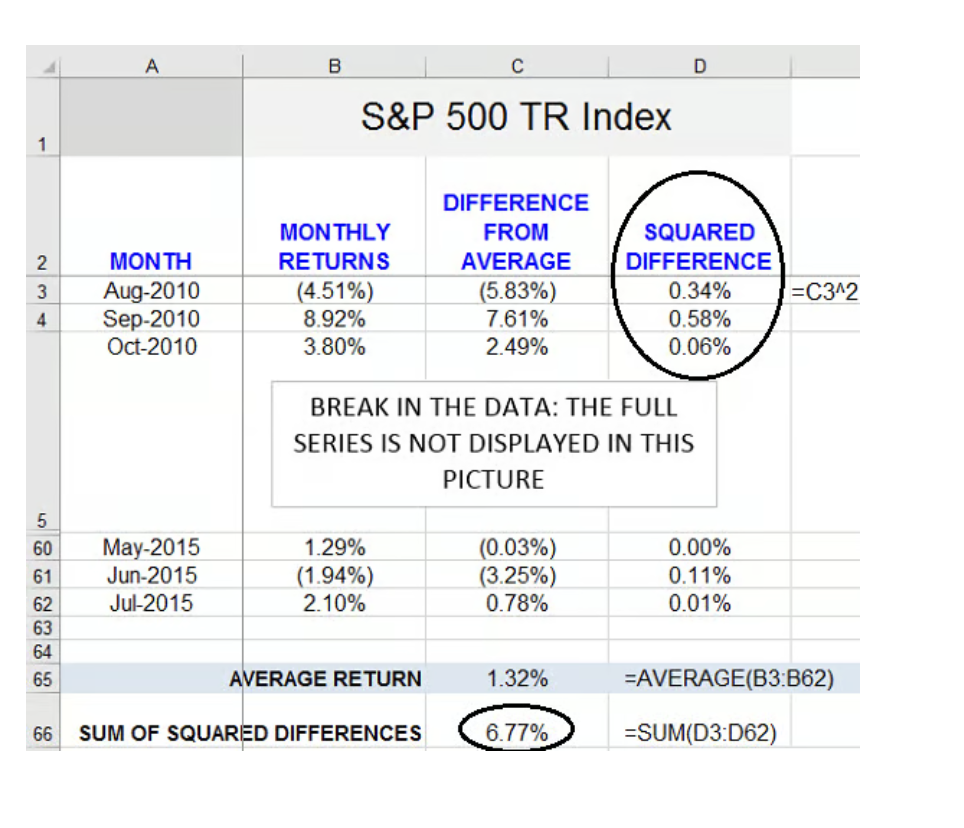
For example, for August 2010 (row 3), the difference squared is equal to: -5.83% ^ 2 = 0.34%, which is the figure displayed in Cell D3. (The Excel formula we used to obtain that figure is shown immediately to the right.)
We then add up all the squared differences using Excel's "Sum" function. The result, 6.77%, is in C66.
Step 5: Divide the sum of squared differences by n - 1
We're almost home!
Cell C67 below contains the number of observations (i.e., the number of months). Just below that, in Cell C68, we finally obtain the variance. The formula we use for the variance is displayed immediately to the right and shows that we divide the sum of squared differences (Cell C66) by the number of months (Cell C67) less 1.
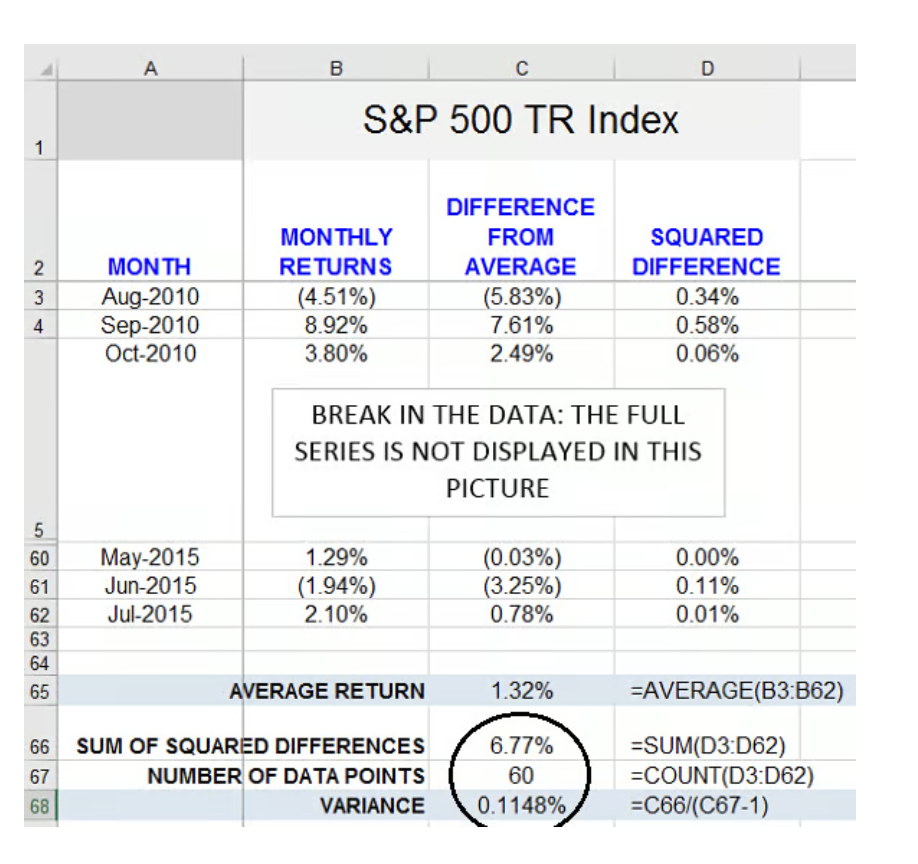
The variance is 0.1148% (Cell C68).
You can confirm with a calculator that:
variance = 6.77% / 59 = 0.1147%. (The difference is due to rounding errors.)
Is there an easier way to do this?
Yes, there is! Excel has a variance function, "VAR," which calculates the variance of a set of numbers directly, eliminating the need for all those intermediary steps, which are pretty tiresome. The result is in Cell C70 below:
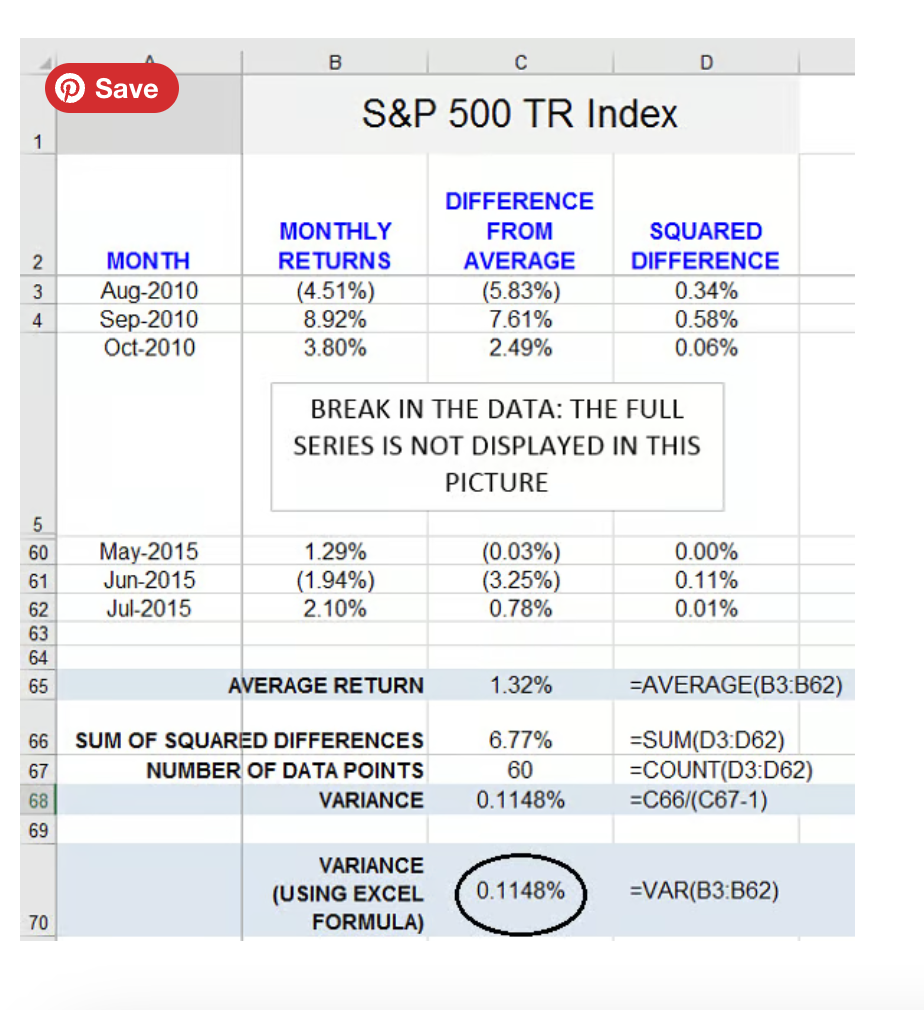
Note that the result matches the one we derived independently, which is comforting.
That's it! You now know how to calculate the historical variance of a return series.
Related investing topics
Last thought: Why would you want to calculate the historical variance of returns?
If you made it this far, it's a fair bet that you already have a reason for wanting to calculate a historical variance.
Suffice it to say that variance of returns is one of the two building blocks of the mean-variance framework, also known as "modern portfolio theory," that economist Harry Markowitz introduced in 1952, for which he was later awarded the Nobel Prize. Mean-variance analysis enables investors to construct a portfolio of assets that maximizes expected return for a given level of risk. In this framework, risk is defined by the variance of returns.
Want to find the right broker for you? Pop over to The Motley Fool's Broker Center and get started today.
This article is part of The Motley Fool's Knowledge Center, which was created based on the collected wisdom of a fantastic community of investors. We'd love to hear your questions, thoughts, and opinions on the Knowledge Center in general or this page in particular. Your input will help us help the world invest, better! Email us at [email protected]. Thanks -- and Fool on!


