The efficient frontier is the set of portfolios maximizing expected return for a given level of risk, as measured by the standard deviation of returns. Theorized by Nobel laureate Harry Markowitz, the efficient frontier is a cornerstone of his modern portfolio theory. Investors can use the efficient frontier to see the benefits of portfolio diversification in maximizing their returns for their given risk tolerance.

What is the efficient frontier?
What is the efficient frontier?
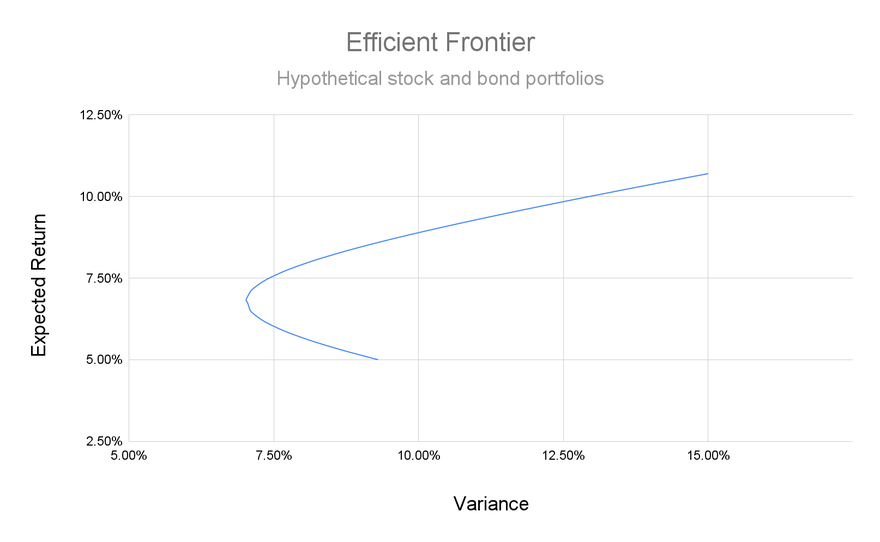
The efficient frontier is a graphical representation of portfolios that use a mix of asset classes to maximize returns for a given level of risk. Portfolios that fall to the right of the efficient frontier on the graph are suboptimal outcomes that produce inferior expected returns with increased risk.
The efficient frontier is based on theoretical returns and the correlations between asset classes. Given those numbers, one can calculate the efficient frontier for a portfolio containing any or all of those assets at different weightings in the portfolio.
Typically, portfolios on the efficient frontier exhibit greater diversification than those that fall to the right.
Why does it matter?
Why does the efficient frontier matter?
The efficient frontier shows investors the proper level of portfolio diversification for a given level of risk tolerance.
That means consulting the graph could lead you toward a better portfolio that can produce the same level of theoretical returns over time without as much variance in your portfolio balance. Likewise, if you’re comfortable with the variance in your returns, you could be achieving better returns with a properly diversified portfolio.
Many robo-advisors rely on the efficient frontier and modern portfolio theory to develop their clients' portfolios. Their models look at the expected returns of multiple asset classes and the correlations between those returns to optimize portfolios and automatically rebalance them.
Investors may note there’s a curve to the efficient frontier. That indicates diminishing returns as risk increases. That may give investors a good idea of how much risk they should take to achieve reasonable returns in their portfolio.
How does it work?
How does the efficient frontier work?
The inputs for graphing the efficient frontier are the expected return and the standard deviation of those returns for each asset class in a portfolio. It also accounts for the co-variance between the asset classes.
The expected returns of each possible combination of assets are then plotted on the y-axis of the graph against the standard deviation of those returns on the x-axis. The efficient frontier is the set of portfolios that maximizes expected return at the given standard deviation.
Let’s say we have two asset classes: Stocks and treasury bonds. One is considered risky, and the other is considered conservative.
| Asset | Expected Return | Standard Deviation |
|---|---|---|
| Stocks | 11% | 15% |
| Bonds | 5% | 10% |
Importantly, they also have a correlation of negative 0.3, which means when stocks go up in value the bonds will often go down in value and vice versa.
Here’s a sampling of some potential portfolios you could construct.
| Stock Allocation | Bond Allocation | Expected Return | Standard Deviation |
|---|---|---|---|
| 0% | 100% | 5% | 10% |
| 10% | 90% | 5.6% | 8.67% |
| 20% | 80% | 6.2% | 7.66% |
| 30% | 70% | 6.8% | 7.1% |
| 40% | 60% | 7.4% | 7.1% |
| 50% | 50% | 8% | 7.66% |
| 60% | 40% | 8.6% | 8.68% |
| 70% | 30% | 9.2% | 10.02% |
| 80% | 20% | 9.8% | 11.56% |
| 90% | 10% | 10.4% | 13.23% |
| 100% | 00% | 11% | 15% |
A few things should stand out from the table above.
First, you can achieve lower variance in returns by adding stocks to an all-bond portfolio. As you add stocks, the standard deviation of returns goes from 10% down to about 7% with a 35% allocation toward stocks.
Second, the first few sets of portfolios are inefficient because you can achieve better returns at the same level of risk. The efficient frontier would start at the portfolio with about 35% allocated toward stocks and 65% in bonds and move up and to the right from there, as can be seen in the chart above.
Related investing topics
Problems with the efficient frontier
Problems with the efficient frontier
The efficient frontier is built on several assumptions, which means it may not reflect the reality of the situation.
First of all, expected returns, standard deviations, and asset class correlations are typically based on historical data. There’s no guarantee that the future will look like the past. In fact, it very likely won’t look exactly the same.
Second, the efficient frontier calculation assumes security returns follow a normal distribution, where nearly all returns fall within three standard deviations of the mean. In fact, some asset classes may produce returns much further away from the mean in some periods.
The efficient frontier should be considered more of a guide than a set-in-stone fact for investors to follow.


