Google makes it easy to track stocks with Google Finance, a free set of tools to keep up with your portfolio. Although you might use the Google Finance dashboard to follow your portfolio performance or create a watchlist, you can also build your own portfolio tracker using Google Sheets. Google makes it easy to import data about stocks, mutual funds, and currencies with the versatile GOOGLEFINANCE formula. You can make custom tables, dashboards, and charts to follow your portfolio however you wish.
Read on to learn how to track stocks with Google Finance and build your own portfolio tracker in Google Sheets.

How to set it up
How to set up Google Finance
Google Finance is a free tool provided by Google to help you track your portfolio performance and keep up with news and events for the stocks you own or have on your watch list.
Anyone with a Google account can access Google Finance at finance.google.com. Once you're logged in, setting up a portfolio or watch list of stocks is fairly straightforward.
To create a portfolio:
- Click "New portfolio" on the right side of the page.
- Enter the name of the portfolio.
- You can choose to make it a playground portfolio if you'd like to simulate market performance.
- Click "Save."
Once you have a new portfolio, you'll need to add your holdings to it.
- Click on your new portfolio, which is found under the display of "Top movers on your lists."
- Click "Add investments."
- Type in the name or symbol of a stock you own.
- Indicate the number of shares, purchase date, and purchase price.
- If you made multiple purchases, you can click the button that says "More purchases of [STOCK]."
- If you have more stocks, click "Save & add another."
- Once you've added all your stocks and exchange-traded funds (ETFs), click "Save."
If you simply want to add a stock to your watch list to receive news and events:
- Click on "Watchlist."
- Click "+ Investment."
- Type in the investment name or stock symbol.
- Click on the investment to add it to your watchlist.
Once you have everything set up, you'll see a customized dashboard with your portfolio performance, top stories about companies you own or have on your watch list and upcoming earnings reports.
Using Google Sheets
Integrate it with Google Sheets
If you'd like to build your own custom portfolio tracker and dashboard, Google makes it easy by integrating Google Finance with Google Sheets. Users can access financial data about stocks, ETFs, market indexes, and currencies (including cryptocurrency). They can then use Sheets to organize and manipulate those data however they want.
The key to making your own stock tracker in Google Sheets is the GOOGLEFINANCE formula. The GOOGLEFINANCE formula is a versatile tool that allows you to specify which piece of data you'd like to import into a cell on your spreadsheet.
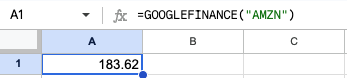
The most basic use of GOOGLEFINANCE is to import the current price of a stock. To do so, you'll use the following instructions.
- Select a cell on your Google Sheet.
- Type "=GOOGLEFINANCE(" (don't forget the equal sign)
- Then, type the ticker of the stock you want the price of in quotes. For example, if you want to get the price of Amazon shares, type "AMZN" (including the quotes).
- Close your parentheses. Type ")"
- Hit "Enter". After loading, the sheet will display the most recent price of your stock.
Note that grabbing the stock price is the default function of GOOGLEFINANCE. But you can specify many more attributes using the function to populate a full dashboard for your portfolio.
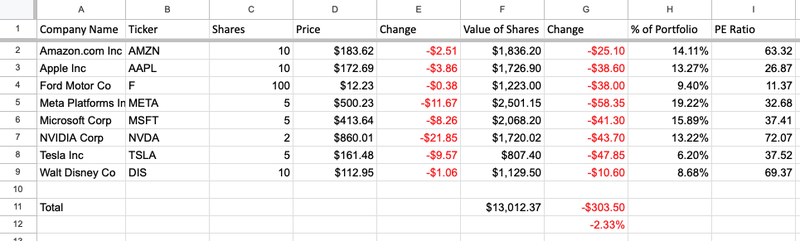
You might build a whole spreadsheet containing the ticker, the name of the company, how many shares you own, the price of the stock, price changes over the last trading day, the current value of your shares, the change in the value of your holding over the last trading day, and more. You'll see how to do that in the next section.
Formulas to use
Google Finance formulas to use
To build out your portfolio tracking sheet, you'll need to know a little more about how the GOOGLEFINANCE formula works.
After you type in "=GOOGLEFINANCE" and specify the ticker you want, you can also specify any one of a number of attributes you'd like to collect. You simply put a comma after specifying the ticker and type in the attribute. You'll find a full table of useful attributes below.
You may also specify a start date, end date, and interval after the attribute, which can be useful in some cases.
Then, you can manipulate the data in your sheet to provide important information, like the total value of your stock holdings or how much your entire portfolio gained or lost over the past day.
Here's an example of a basic portfolio dashboard.
Unfortunately, you might not be able to get every piece of data through the Google Finance formula. One of the biggest omissions for stocks is dividends. But you should be able to get most of what you need to build a good dashboard to track your stocks.
Related investing topics
Useful attributes
Useful attributes in Google Sheets
Here's a table of useful Google Finance formula attributes.
| Attribute | Description |
|---|---|
| "name" | The name of the company |
| "high" | The high price for a specified date, or current day if none specified |
| "low" | The low price for a specified date, or current day if none specified |
| "marketcap" | The market capitalization of the stock |
| "pe" | The stock's price/earnings ratio |
| "eps" | The company's earnings per share over the trailing 12 months |
| "high52" | The 52-week high |
| "low52" | The 52-week low |
| "change" | The price change since the previous day's close |
| "closeyest" | The previous day's closing price |
FAQ
Tracking stocks with Google Finance: FAQ
Can you get stock data on Google Sheets?
Yes. Using the GOOGLEFINANCE formula, you can import plenty of stock data into a Google Sheet. The formula takes a stock ticker and an attribute and returns the requested data. You may also specify a date or set of dates for which you'd like to retrieve specific attributes, such as closing price.
Does Google Sheets have a stock tracker?
Not exactly, but you can make one by using the GOOGLEFINANCE formula. The formula can import raw data about a stock, such as its current trading price, high, low, and change from yesterday's closing price. You can then take those data and build your own stock tracker.
How do I make a stock chart in Google Sheets?
You can use the GOOGLEFINANCE formula to import all historical data on a specified stock by using the formula as follows: =GOOGLEFINANCE(ticker, "all," [start_date], [end_date], [interval]). That will populate the sheet with the open, high, low, close, and volume for the period specified with given intervals, either daily or weekly. From there, you can put the table into a chart. You can use a candle chart to display the open, high, low, and close. You could also use a simple line chart for each interval's closing price. You may represent volume within the chart using a bar graph.