Average House Price by State Heading Into 2026
KEY POINTS
- The median home sales price in the United States was $405,300 in the fourth quarter of 2025. The average home sales price is $534,000.
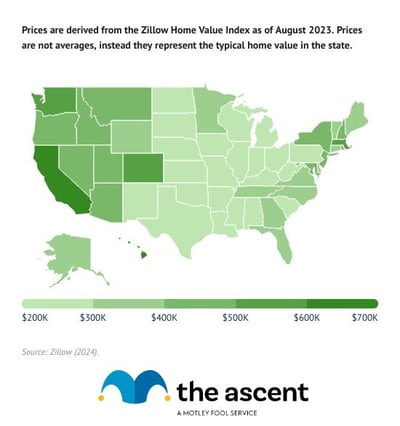
- Hawaii is the most expensive state to buy a house, with a median home value of $817,958, according to the Zillow Home Value Index average over the fourth quarter of 2025.
- West Virginia is the least expensive state to buy a house, with an average home value of $167,491, according to the Zillow Home Value Index.
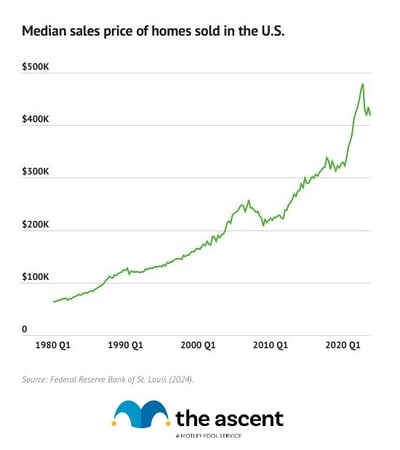
The median house price is $405,300 as of the fourth quarter of 2025, according to the Federal Reserve Bank of St. Louis. That's down $4,800 from the previous quarter and $14,000 lower than the previous year.
The average house price in the fourth quarter of 2025 was $534,000. That's up from $508,100 in the previous quarter, and from $510,900 in the previous year.
House prices rose sharply from mid-2021 through late 2022, but the market has started to cool. The median home sales price in the U.S. declined in three out of four quarters in 2023, but just one quarter in 2024. Still, the median home sales price fell overall in 2024 and in three out of four quarters in 2025.
Mortgage rates dropped significantly in 2020, driving up demand as home buyers looked to take advantage. The COVID-19 pandemic also led consumers to shift spending toward housing and pushed more millennials toward homeownership. Starting in 2022, however, mortgage rates began to rise rapidly as the Federal Reserve raised rates, and house prices have dropped from their peak. Mortgage rates declined from the fall of 2023 through the fall of 2024, but rose in the first half of 2025, only to decline again.
Read on for a look at what average house prices are across the country.
Average home price in the United States: $534,000
The average home sales price is $534,000 as of the fourth quarter of 2025. That's a 5% increase from the previous quarter and the previous year.
The median home sales price is $$405,300 as of the fourth quarter of 2025. That's a 1% decrease quarter over quarter and a 3% decrease from the previous year.
The average cost of a house in the United States has increased over the past four decades. Here's a look at how the median and average home sales prices have changed over the last 40 years (prices are for the first quarter of each year listed unless otherwise specified):
| Year | Median Sales Price of Homes in the U.S. | Average Sales Price of Homes in the U.S. |
|---|---|---|
| 1980 | $63,700 | $73,600 |
| 1985 | $82,800 | $98,500 |
| 1990 | $123,900 | $149,500 |
| 1995 | $130,000 | $153,500 |
| 2000 | $165,300 | $202,900 |
| 2005 | $232,500 | $288,500 |
| 2010 | $222,900 | $275,300 |
| 2015 | $289,200 | $348,000 |
| 2020 | $329,000 | $383,000 |
| 2025 Q4 | $405,300 | $534,000 |
Between 1980 and 2020, the median home sales price increased by 416%. From 1980 to the second quarter of 2025, home sales prices rose 544%.
The gap between those percentage changes is due to home prices rising rapidly from 2020 through late 2022. From the first quarter of 2020 to the fourth quarter of 2022, the median home sales price rose 46% from $329,000 to $479,500, among the fastest rates of median home sales price increases in U.S. history.
Typical home value in the United States: $355,963
The Federal Reserve only provides data on home sales prices and does not include state-level data. The Zillow Home Value Index (ZHVI), however, does provide that data. The ZHVI isn't an average, but it represents the typical home value in a given area. In the United States as a whole, the typical home value, defined as the average ZHVI for the fourth quarter of 2025, was $355,963.
Housing affordability varies by state. For a look at house prices in each state, the median income by state, and housing affordability, read on.
Typical home value by state
Typical home value in Alabama: $227,650 (64% of typical U.S. price)
- Typical single-family home value in Q4 2025: $227,650
- Median household income as a percentage of home value: 26%
Homes in Alabama are among the most affordable in the country. The typical home value is just 64% of the national average, with household income covering over a quarter of that value.
Typical home value in Alaska: $372,716 (104% of typical U.S. price)
- Typical single-family home value in Q4 2025: $372,716
- Median household income as a percentage of home value: 24%
Alaska's home values sit right at the national average, though high incomes only partially offset the cost. Households cover about a quarter of the typical home value with annual earnings.
Typical home value in Arizona: $416,506 (117% of typical U.S. price)
- Typical single-family home value in Q4 2025: $416,506
- Median household income as a percentage of home value: 18%
Arizona homes are priced well above the national average, and affordability is a challenge. The typical household earns just 18% of the home's value annually.
Typical home value in Arkansas: $213,134 (60% of typical U.S. price)
- Typical single-family home value in Q4 2025: $213,134
- Median household income as a percentage of home value: 26%
Arkansas is one of the most affordable states in the country. Home values are just 60% of the national average, and households cover more than a quarter of that with annual income.
Typical home value in California: $752,792 (211% of typical U.S. price)
- Typical single-family home value in Q4 2025: $752,792
- Median household income as a percentage of home value: 12%
California has some of the least affordable housing in the nation. Home values more than double the national average, and the typical household earns just 12 cents for every dollar of home value.
Typical home value in Colorado: $529,284 (148% of typical U.S. price)
- Typical single-family home value in Q4 2025: $529,284
- Median household income as a percentage of home value: 17%
Colorado's home values are nearly 50% above the national average, making affordability a real stretch. Households cover only 17% of the typical home value with annual earnings.
Typical home value in Connecticut: $419,061 (117% of typical U.S. price)
- Typical single-family home value in Q4 2025: $419,061
- Median household income as a percentage of home value: 21%
Connecticut home values run above the national average, though above-average incomes help offset some of the cost. Households cover about a fifth of the typical home value annually.
Typical home value in Delaware: $394,476 (111% of typical U.S. price)
- Typical single-family home value in Q4 2025: $394,476
- Median household income as a percentage of home value: 21%
Delaware's home values are modestly above the national average. Household income covers about 21% of the typical home value, putting affordability near the middle of the pack.
Typical home value in the District of Columbia: $570,244 (160% of typical U.S. price)
- Typical single-family home value in Q4 2025: $570,244
- Median household income as a percentage of home value: 18%
D.C. home values are 60% above the national average. Despite having the highest median income in the data set, households still cover only 18% of the typical home value -- a sign of just how expensive the market is.
Typical home value in Florida: $370,467 (104% of typical U.S. price)
- Typical single-family home value in Q4 2025: $370,467
- Median household income as a percentage of home value: 19%
Florida home values are right at the national average, but below-average incomes make affordability a challenge. Households cover just 19% of the typical home's value each year.
Typical home value in Georgia: $326,179 (91% of typical U.S. price)
- Typical single-family home value in Q4 2025: $326,179
- Median household income as a percentage of home value: 22%
Georgia home values sit just below the national average, and near-average incomes keep affordability in a reasonable range. Households cover about 22% of the typical home value.
Typical home value in Hawaii: $817,958 (229% of typical U.S. price)
- Typical single-family home value in Q4 2025: $817,958
- Median household income as a percentage of home value: 11%
Hawaii is the least affordable state in the nation. Home values are more than double the national average, and the typical household earns just 11 cents for every dollar of home value.
Typical home value in Idaho: $458,425 (128% of typical U.S. price)
- Typical single-family home value in Q4 2025: $458,425
- Median household income as a percentage of home value: 16%
Idaho home values have climbed well above the national average in recent years, and incomes haven't kept pace. Households cover just 16% of the typical home value annually.
Typical home value in Illinois: $274,373 (77% of typical U.S. price)
- Typical single-family home value in Q4 2025: $274,373
- Median household income as a percentage of home value: 28%
Illinois offers relatively strong affordability. Home values are well below the national average, and above-average incomes mean households cover more than a quarter of the typical home value each year.
Typical home value in Indiana: $244,196 (68% of typical U.S. price)
- Typical single-family home value in Q4 2025: $244,196
- Median household income as a percentage of home value: 27%
Indiana is one of the more affordable states in the Midwest. Home values are well below the national average, and households cover more than a quarter of the typical home value with annual income.
Typical home value in Iowa: $222,516 (62% of typical U.S. price)
- Typical single-family home value in Q4 2025: $222,516
- Median household income as a percentage of home value: 31%
Iowa ranks among the most affordable states in the country. Home values are just 62% of the national average, and households cover nearly a third of that with annual earnings.
Typical home value in Kansas: $233,629 (65% of typical U.S. price)
- Typical single-family home value in Q4 2025: $233,629
- Median household income as a percentage of home value: 30%
Kansas offers strong affordability. Home values are just 65% of the national average, and households cover 30% of the typical home value annually -- one of the better income-to-value ratios in the country.
Typical home value in Kentucky: $224,107 (63% of typical U.S. price)
- Typical single-family home value in Q4 2025: $224,107
- Median household income as a percentage of home value: 26%
Kentucky home values are well below the national average, keeping affordability strong. Households cover about 26% of the typical home value with annual income.
Typical home value in Louisiana: $205,697 (58% of typical U.S. price)
- Typical single-family home value in Q4 2025: $205,697
- Median household income as a percentage of home value: 27%
Louisiana has some of the lowest home values in the country at just 58% of the national average. Despite below-average incomes, households still cover more than a quarter of the typical home value.
Typical home value in Maine: $393,743 (110% of typical U.S. price)
- Typical single-family home value in Q4 2025: $393,743
- Median household income as a percentage of home value: 18%
Maine home values have climbed above the national average in recent years, while incomes remain below average. Households cover just 18% of the typical home value annually.
Typical home value in Maryland: $420,515 (118% of typical U.S. price)
- Typical single-family home value in Q4 2025: $420,515
- Median household income as a percentage of home value: 23%
Maryland home values are well above the national average, though the state's high incomes help soften the blow. Households cover about 23% of the typical home value annually.
Typical home value in Massachusetts: $633,864 (178% of typical U.S. price)
- Typical single-family home value in Q4 2025: $633,864
- Median household income as a percentage of home value: 15%
Massachusetts has some of the most expensive housing in the country. Home values are 78% above the national average, and even with high incomes, households cover just 15% of the typical home value each year.
Typical home value in Michigan: $247,471 (69% of typical U.S. price)
- Typical single-family home value in Q4 2025: $247,471
- Median household income as a percentage of home value: 27%
Michigan offers solid affordability. Home values are well below the national average, and households cover more than a quarter of the typical home value with annual earnings.
Typical home value in Minnesota: $332,711 (93% of typical U.S. price)
- Typical single-family home value in Q4 2025: $332,711
- Median household income as a percentage of home value: 25%
Minnesota home values are just below the national average, and above-average incomes keep affordability in good shape. Households cover a quarter of the typical home value annually.
Typical home value in Mississippi: $184,535 (52% of typical U.S. price)
- Typical single-family home value in Q4 2025: $184,535
- Median household income as a percentage of home value: 29%
Mississippi has the lowest home values in the country at just 52% of the national average. Despite having the lowest median income in the dataset, households still cover nearly 30% of the typical home value.
Typical home value in Missouri: $251,520 (70% of typical U.S. price)
- Typical single-family home value in Q4 2025: $251,520
- Median household income as a percentage of home value: 26%
Missouri home values are well below the national average, offering solid affordability. Households cover about 26% of the typical home value with annual income.
Typical home value in Montana: $447,080 (125% of typical U.S. price)
- Typical single-family home value in Q4 2025: $447,080
- Median household income as a percentage of home value: 15%
Montana home values have surged above the national average, while incomes remain below average. Households cover just 15% of the typical home value annually, one of the weaker ratios in the country.
Typical home value in Nebraska: $264,854 (74% of typical U.S. price)
- Typical single-family home value in Q4 2025: $264,854
- Median household income as a percentage of home value: 26%
Nebraska offers good affordability, with home values at 74% of the national average. Households cover about 26% of the typical home value with annual earnings.
Typical home value in Nevada: $440,141 (123% of typical U.S. price)
- Typical single-family home value in Q4 2025: $440,141
- Median household income as a percentage of home value: 16%
Nevada home values are well above the national average, and average incomes don't stretch far. Households cover just 16% of the typical home value annually.
Typical home value in New Hampshire: $488,701 (137% of typical U.S. price)
- Typical single-family home value in Q4 2025: $488,701
- Median household income as a percentage of home value: 18%
New Hampshire home values are significantly above the national average. Despite above-average incomes, households cover only 18% of the typical home value each year.
Typical home value in New Jersey: $554,289 (155% of typical U.S. price)
- Typical single-family home value in Q4 2025: $554,289
- Median household income as a percentage of home value: 17%
New Jersey has some of the highest home values in the country at 55% above the national average. Even with the state's high incomes, households cover just 17% of the typical home value annually.
Typical home value in New Mexico: $306,417 (86% of typical U.S. price)
- Typical single-family home value in Q4 2025: $306,417
- Median household income as a percentage of home value: 19%
New Mexico home values are below the national average, but below-average incomes limit the affordability advantage. Households cover just 19% of the typical home value annually.
Typical home value in New York: $494,004 (138% of typical U.S. price)
- Typical single-family home value in Q4 2025: $494,004
- Median household income as a percentage of home value: 16%
New York home values are well above the national average. Household income covers just 16% of the typical home value annually, reflecting a market where prices have far outpaced earnings.
Typical home value in North Carolina: $328,236 (92% of typical U.S. price)
- Typical single-family home value in Q4 2025: $328,236
- Median household income as a percentage of home value: 21%
North Carolina home values are just below the national average. With slightly below-average incomes, households cover about 21% of the typical home value each year.
Typical home value in North Dakota: $271,120 (76% of typical U.S. price)
- Typical single-family home value in Q4 2025: $271,120
- Median household income as a percentage of home value: 27%
North Dakota offers solid affordability. Home values are well below the national average, and near-average incomes mean households cover more than a quarter of the typical home value annually.
Typical home value in Ohio: $232,179 (65% of typical U.S. price)
- Typical single-family home value in Q4 2025: $232,179
- Median household income as a percentage of home value: 28%
Ohio is one of the more affordable states in the Midwest. Home values are just 65% of the national average, and households cover more than a quarter of the typical home value with annual income.
Typical home value in Oklahoma: $212,367 (60% of typical U.S. price)
- Typical single-family home value in Q4 2025: $212,367
- Median household income as a percentage of home value: 28%
Oklahoma is among the most affordable states in the country. Home values are just 60% of the national average, and households cover more than a quarter of the typical home value each year.
Typical home value in Oregon: $485,877 (136% of typical U.S. price)
- Typical single-family home value in Q4 2025: $485,877
- Median household income as a percentage of home value: 16%
Oregon home values are well above the national average, and average incomes don't go far. Households cover just 16% of the typical home value annually.
Typical home value in Pennsylvania: $274,529 (77% of typical U.S. price)
- Typical single-family home value in Q4 2025: $274,529
- Median household income as a percentage of home value: 26%
Pennsylvania offers solid affordability, with home values at 77% of the national average. Households cover about 26% of the typical home value with annual earnings.
Typical home value in Rhode Island: $483,157 (135% of typical U.S. price)
- Typical single-family home value in Q4 2025: $483,157
- Median household income as a percentage of home value: 17%
Rhode Island home values are well above the national average, and affordability is strained. Households cover just 17% of the typical home value annually despite above-average incomes.
Typical home value in South Carolina: $297,177 (83% of typical U.S. price)
- Typical single-family home value in Q4 2025: $297,177
- Median household income as a percentage of home value: 22%
South Carolina home values are below the national average, offering moderate affordability. Households cover about 22% of the typical home value with annual income.
Typical home value in South Dakota: $304,507 (85% of typical U.S. price)
- Typical single-family home value in Q4 2025: $304,507
- Median household income as a percentage of home value: 23%
South Dakota home values are slightly below the national average. With near-average incomes, households cover about 23% of the typical home value each year.
Typical home value in Tennessee: $323,944 (91% of typical U.S. price)
- Typical single-family home value in Q4 2025: $323,944
- Median household income as a percentage of home value: 20%
Tennessee home values are just below the national average, but below-average incomes limit affordability. Households cover just 20% of the typical home value annually.
Typical home value in Texas: $294,786 (83% of typical U.S. price)
- Typical single-family home value in Q4 2025: $294,786
- Median household income as a percentage of home value: 25%
Texas home values are below the national average, and near-average incomes keep affordability reasonable. Households cover a quarter of the typical home value with annual earnings.
Typical home value in Utah: $523,689 (147% of typical U.S. price)
- Typical single-family home value in Q4 2025: $523,689
- Median household income as a percentage of home value: 17%
Utah home values are nearly 50% above the national average, and despite above-average incomes, households cover just 17% of the typical home value annually.
Typical home value in Vermont: $381,885 (107% of typical U.S. price)
- Typical single-family home value in Q4 2025: $381,885
- Median household income as a percentage of home value: 19%
Vermont home values are modestly above the national average, while incomes remain near average. Households cover just 19% of the typical home value each year.
Typical home value in Virginia: $400,017 (112% of typical U.S. price)
- Typical single-family home value in Q4 2025: $400,017
- Median household income as a percentage of home value: 21%
Virginia home values are above the national average, though the state's high incomes help offset some of the cost. Households cover about 21% of the typical home value annually.
Typical home value in Washington: $582,588 (163% of typical U.S. price)
- Typical single-family home value in Q4 2025: $582,588
- Median household income as a percentage of home value: 16%
Washington home values are well above the national average. Despite high incomes, households cover just 16% of the typical home's value each year, a sign of how expensive the market has become.
Typical home value in West Virginia: $167,491 (47% of typical U.S. price)
- Typical single-family home value in Q4 2025: $167,491
- Median household income as a percentage of home value: 32%
West Virginia has the lowest home values in the country at just 47% of the national average. Households cover nearly a third of the typical home value with annual income, the best income-to-value ratio in the nation.
Typical home value in Wisconsin: $313,864 (88% of typical U.S. price)
- Typical single-family home value in Q4 2025: $313,864
- Median household income as a percentage of home value: 23%
Wisconsin home values are slightly below the national average. With near-average incomes, households cover about 23% of the typical home value each year.
Typical home value in Wyoming: $352,640 (99% of typical U.S. price)
- Typical single-family home value in Q4 2025: $352,640
- Median household income as a percentage of home value: 20%
Wyoming home values are right at the national average, but low incomes mean households can afford only 20% of the typical home value each year.
How to save to buy a home
With average home prices in the U.S. in flux, you may want to consider how to save if you're thinking of buying a house. Here are a few ways to get ready for a mortgage:
- Take steps to increase your credit score. When applying for a mortgage, home buyers with a FICO® Score of 760 or higher typically qualify for the lowest mortgage rates.
- Save up money for a larger down payment. Putting 20% down means you don't need to pay private mortgage insurance.
- Shop around when choosing a mortgage lender. Be sure to consider the best mortgage lenders. And don't forget to check out online mortgage lenders. Different lenders will offer different APRs, and even a slightly lower one can result in big long-term savings.
Motley Fool Money also has a mortgage calculator that can help estimate mortgage payments based on home price, mortgage rates, down payments, and other factors.
-
Sources
- Census Bureau (2023). "S1903 Median income in the past 12 months."
- Joint Center for Housing Studies of Harvard University (2021). "Extraordinary and Unexpected Pandemic Increase in House Prices: Causes and Implications."
- St. Louis Fed (2026). "Median Sales Price of Houses Sold for the United States."
- Zillow (2026). "Housing Data."
Our Research Expert
Jack Caporal is the Research Director for The Motley Fool and Motley Fool Money and has worked full-time for the company since 2021. Jack leads efforts to identify and analyze trends shaping investing and personal financial decisions across the United States. His research has appeared in thousands of media outlets including Harvard Business Review, The New York Times, Bloomberg, and CNBC, and has been cited in congressional testimony. He previously covered business and economic trends as a reporter and policy analyst in Washington, D.C. He serves as Chair of the Trade Policy Committee at the World Trade Center in Denver, Colorado. He holds a B.A. degree in International Relations with a concentration in International Economics from Michigan State University.
Motley Fool Stock Disclosures
Jack Caporal has no position in any of the stocks mentioned. The Motley Fool has positions in and recommends XRP and Zillow Group. The Motley Fool has a disclosure policy.