Annual Tax Refunds: When Will I Get My Tax Refund?
Filing taxes isn't anyone's idea of a good time, but a tax refund is a light at the end of the tunnel. Considering the Internal Revenue Service (IRS) refunded $172 billion in income tax in 2023, plenty of filers get a sizable return.
How long does it take to receive your tax refund? What's the average tax refund amount? And do certain characteristics, such as income or marital status, influence tax refund amounts?
To find out, we analyzed the most recent IRS data on tax refunds. In the sections that follow, you'll learn exactly which filers get the biggest refunds.
Jump To
- Key findings
- How long it takes to get your tax refund
- Average tax refund in 2023: $2,903
- What to expect from your tax refund in 2024
- How to get the the largest tax refund in 2024
- Average tax refund by income
- Average tax refund by filing status
- Average tax refund by age
- Average tax refund by state
- FAQs: How to check your income tax refund status and more
- Methodology
- Sources
Key findings
- Average tax return: The average tax refund in 2023 was $2,903. That's down 11% from 2022, when the average tax return was $3,263.
- When will I get my tax refund? Nine out of 10 tax refunds are issued in less than 21 days, according to the IRS. Most states estimate that state tax refunds are issued within 10 weeks.
Numbers on tax refunds by income, age, and filing status are available only through tax year 2020 (2021 filing year).
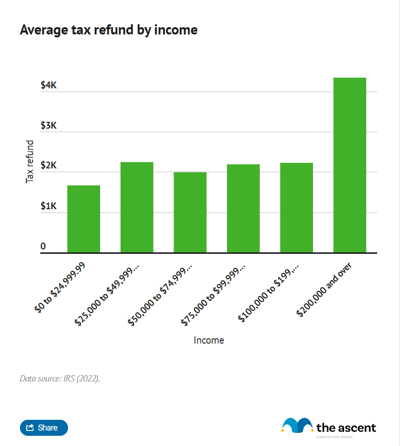
- Tax refunds by income: Average tax returns tend to rise with income. The average tax refund in 2020 for someone making between $50,000 and $75,000 was $2,139. The average tax return for someone making $200,000 or more was $2,879.
- Tax returns by age: Tax refund amounts peak for adults in the 35-to-44 age range, and then steadily decline going forward.
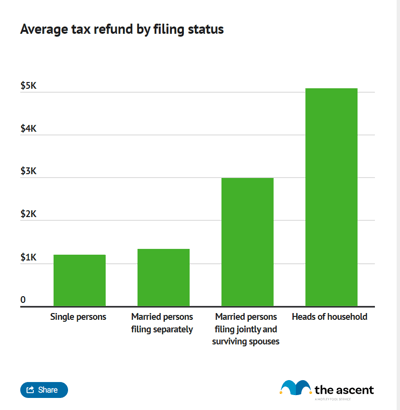
- Tax refunds by filing status: Heads of household had the highest average tax return in 2021, receiving $4,609 back. Single filers received the smallest tax refund ($1,315). Married couples received an average refund of $2,986.
How long it takes to get your tax refund
Nine out of 10 tax refunds are issued within 21 days, according to the IRS.
Twenty-four hours after filing your refund online, you can access the IRS Where's My Refund tool to get daily updates on your tax refund status. Paper filers have to wait six months or more before the tool becomes available.
The tool shows progress in three phases:
- Return received
- Refund approved
- Refund sent
Once your refund is approved, you will be given a date to expect your refund on by the IRS.
Those who file their tax return online and sign up for direct deposit get their tax refund fastest, per the IRS.
Most states estimate that state tax refunds are issued within 10 weeks of processing.
Average tax refund in 2023: $2,903
The average individual income tax refund was $2,903 for the 2022 tax-filing year, an 11% decrease from taxes filed in 2021 when the average refund was $3,263, according to the IRS.
Experts point to the decrease of the Child Tax Credit and Child and Dependent Care Credit to pre-COVID levels as one reason why tax refunds shrunk.
Lisa Greene-Lewis, CPA and tax expert at TurboTax told The Motley Fool Ascent that "some filers did experience lower tax refunds with COVID relief either reverting to pre-COVID tax provisions or going away."
"For instance, the Child Tax Credit was up to $3,600 under COVID Relief but it decreased to pre-COVID relief amounts of up to $2,000," Greene-Lewis added. "The Child and Dependent Care Credit was up to $4,000 for one child and up to $8,000 for 2 or more kids, but it went back to $1,050 for one child and up to $2,100 for two or more kids."
For many consumers, tax refunds are a significant influx of extra cash they get each year. Because of that, it's common for people to plan their finances around their refunds.
Our study on Christmas spending showed that many people plan to use their refunds to pay off their Christmas debt. Some others put their funds in the bank to boost their savings. And there are those who earmark their upcoming tax refunds for big purchases, such as a TV or a down payment on a car.
What to expect from your tax refund in 2024
Changes are coming for the 2023 tax-filing year that could impact the size of tax refunds in 2024. These are the ones that are most likely to affect your potential tax refund.
New income tax brackets
The IRS widened income tax brackets for the 2023 filing year due to inflation.
2023 tax-filing year income tax brackets
| Tax Rate | Taxable income, single | Taxable income, married filing jointly | Taxable income, head of household |
|---|---|---|---|
| 10% | Up to $11,000 | Up to $22,000 | Up to $15,700 |
| 12% | $11,001 to $44,725 | $22,001 to $89,450 | $15,701 to $59,850 |
| 22% | $44,726 to $95,375 | $89,451 to $190,750 | $59,851 to $95,350 |
| 24% | $95,376 to $182,100 | $190,751 to $364,200 | $95,351 to $182,100 |
| 32% | $182,101 to $231,250 | $364,201 to $462,500 | $182,101 to $231,250 |
| 35% | $231,251 to $578,125 | $462,501 to $693,750 | $231,251 to $578,100 |
| 37% | Over $578,125 | Over $693,750 | Over $578,100 |
As a result, filers whose salaries haven't kept pace with inflation may find themselves in a lower income tax bracket than last year.
Higher standard deduction
The IRS increased standard deduction amounts for the 2023 filing year as a result of inflation.
2023 tax filing year standard deductions
| Filing status | 2023 standard deduction |
|---|---|
| Single | $13,850 |
| Married, filing separately | $13,850 |
| Married, filing jointly; qualified widow/er | $27,700 |
| Head of household | $20,800 |
The standard deduction is the amount you can reduce your standard gross income by, which lowers your taxable income. Most filers take the standard deduction rather than an itemized deduction.
A higher standard deduction may help filers fall into a lower income tax bracket, particularly if inflation has outpaced their salary.
1099-K thresholds
The 1099-K form is used to report payments via payment cards and third-party networks, like Venmo, PayPal, and Cash App, for goods and services provided in either business or personal transactions. The threshold for filing a 1099-K in the 2023 tax filing year will remain at $20,000 and 200 transactions. The IRS had previously announced a lower threshold but reverted to the current one. For the 2024 tax year, the 1099-K threshold will be reduced to $5,000.
The 1099-K covers side hustles, like selling crafts on Etsy, earnings from sales on a website like eBay, and ticket resales through platforms like StubHub. Transactions with friends and family are not covered by the 1099-K.
Energy efficiency, clean energy, and electric vehicle tax credits
Tax credits from the Inflation Reduction Act for solar energy installations, home energy efficiency improvements, and electric vehicles (EVs) kick in for the 2023 filing year.
- The solar energy tax credit is now 30% for installations of solar panels and other solar-powered energy efficiency home improvements.
- The energy efficiency home improvement tax credit is now up to 30% of the cost of qualifying home energy efficiency improvements made in the 2023 tax year. The maximum claim is $1,200 for home improvements and $2,000 for qualifying heat pumps and biomass heating solutions. The lifetime dollar limit has been removed.
- Qualifying electric vehicles (EVs) purchased after Jan. 1, 2023, are eligible for a tax credit of up to $7,500.
How to get the the largest tax refund in 2024
While it's not possible to predict how the average refund will change in the 2023 filing year, we asked experts at major tax service providers about how to maximize tax refunds and what changes to watch out for.
Inflation could lead to larger tax returns for some filers due to expanded income tax brackets and larger tax credit amounts, tax experts told The Motley Fool Ascent.
"Refunds should remain stable for most taxpayers with a possible bump due to larger inflation adjustments than last year," says Kathy Pickering, chief tax officer at H&R Block. "Many of the items that affect taxpayers' returns such as tax brackets, credit amounts, and income limitations, fluctuate each year based on certain economic indicators. With the increase in inflation we've faced in the last year, many of these items will be larger than normal, resulting in a slight bump in refunds."
"With inflation adjustments like the standard deduction and income brackets increasing the most they have in decades, about 7%, this could help filers tax outcomes in the upcoming season," Lisa Greene-Lewis, CPA and tax expert at TurboTax told The Motley Fool Ascent.
These are some other tips for maximizing your tax return.
1. Take advantage of credits and deductions
Changes to tax credits aren't the only thing filers should be mindful of this coming tax season -- they should also be cognizant of their own life changes, including changes to income and family size.
Greene-Lewis flagged the following tax credits as ones filers often times miss:
- The Earned Income Tax Credit: a tax credit certain filers may qualify for if they earned less than $59,187 in the 2023 tax filing year.
- The Saver's Credit: a tax credit for low- and moderate-income filers that contribute to a retirement account.
- The Child and Dependent Care Credit: a tax credit for filers that support a child under the age of 13 or a dependent (including those outside their family) that cannot take care of themselves and lived with the filer for more than half of the year.
According to Greene-Lewis, 1 out of 5 filers miss the Earned Income Tax Credit, which maxes out at $7,430, and others may not realize they're eligible for the dependent part of the Child and Dependent Care Credit or the Saver's Credit.
2. Organize W-2s and other paperwork
To maximize tax refunds and avoid delays or letters from the IRS, filers should make sure they have all their paperwork in order, including their W-2s and 1099s.
"One of the most common mistakes is reporting the wrong taxable income," Pickering says. To avoid this, compare the W-2 or 1099 you receive against your own records. If you think it is wrong, inform the sender and ask them to file a corrected W-2 or 1099 with the IRS."
Mark Steber, chief tax information officer at Jackson Hewitt, adds, "Personal situations can change annually, but if someone isn't organized these changes can go overlooked. I always recommend people organize; and stay organized throughout the year. Organize tax-related documents into four categories: income items, deductions, life changes, and other."
3. Double-check information entered into tax software
Many tax-filing services transpose information from tax forms to calculate your return, but you should still double-check to make sure that the information received by the service matches what's on your forms.
"One of the most common mistakes is not taking a moment to review the information you entered," Mark Jaeger, vice president of tax development at TaxAct says.
Missing information or entering it incorrectly either through being rushed or disorganized can mean leaving benefits on the table. In that instance, the IRS won't catch your mistake. "It is simply a mistaken concept that if you leave off a benefit the IRS will 'find it and add it back and send you more money.' Nothing could be farther from the truth," says Steber.
Steber points out that there's a growing trend of taxpayers making small but costly mistakes on their filings. "These mistakes have resulted in thousands of taxpayers seeing a delay in receiving their tax refund because their return is sent to the IRS' error resolution system," he says.
4. Make a plan to file a tax return
The biggest misstep? Not filing a tax return at all, says Lisa Greene-Lewis, CPA and tax expert at TurboTax.
Individuals who earn below the IRS income tax filing threshold ($13,850 for a single filer and $27,700 for a married couple filing jointly) are likely "leaving money on the table," says Greene-Lewis, who pointed out that those earners may be eligible for the Earned Income Tax Credit.
"The IRS reports over $1 billion in unclaimed refunds that belong to filers who don't file and the average unclaimed refund is over $800," Greene-Lewis told The Motley Fool Ascent.
Average tax refund by income
There's a clear correlation between income and tax refund amounts. Filers who have higher incomes get more back. This average tax return by income chart will give you the details:
Americans who earn $200,000 and over experience a much higher tax return than those who earn less because high earners generally have more cash withheld from their income over the course of the year.
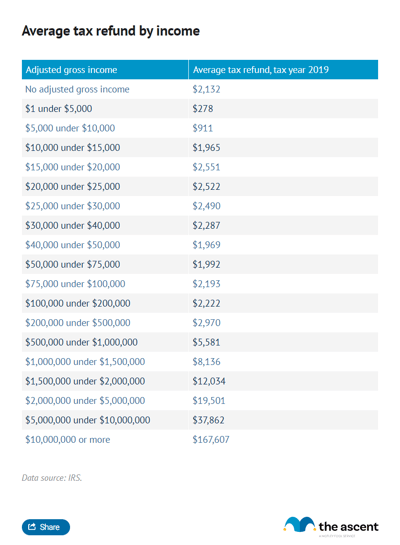
For a more detailed look at the average tax refund across income levels, see the table below.

A more detailed breakdown reveals that tax refund amounts and incomes are related but anomalies exist.
Filers with no adjusted gross income (AGI) posted an average tax refund of $2,207, which is more than or close to the average returns for most income bands up to those who earn $200,000 or more. Filers with no AGI or negative AGI aren't necessarily earning no income. It's more likely that they're taking advantage of tax deductions.
Another departure -- Americans who made $15,000 to $19,999 had a higher average refund than every subsequent group up to those making $200,000 or more. This isn't a one-year quirk. Earners in the $25,000 to $30,000 band had a higher average tax return than every group up to those making $200,000 to $499,999.
Average tax refund by filing status
Filing status makes a significant difference in the amount of taxes you pay and how much you can receive in your refund.
The difference in average returns of heads of households and single Americans or married couples filing separately is particularly large.

Heads of household received the largest refunds for the 2020 tax year, receiving $4,609 on average.
The average tax refund for single Americans was just $1,315. Married taxpayers filing separately received an average return of slightly more, $1,428.
Married Americans filing jointly and surviving spouses saw an average return of $2,986.
Heads of households -- unmarried filers who pay for at least half their household expenses and have a qualifying dependent -- receive the largest average tax returns because they benefit from the second-largest standard deduction and wider tax brackets than single filers and married Americans that file separately.
Married couples who file jointly and surviving spouses have the widest tax brackets and largest standard deduction.
While some couples consider filing separately to save on taxes, this can end up being a costly tax mistake. Except in select circumstances, filing jointly tends to provide greater savings. According to an analysis from TurboTax, 87% of couples newly filing jointly in 2023 saw their adjusted gross income increase by at least 10%. That opens up more opportunities for income based tax credits and a lower tax rate for higher income.
Average tax refund by age
Tax refund amounts rise with age until reaching a peak with the 35-to-44 group. After that, there's a steady decrease.

For the most part, this follows how incomes rise with age. Most filers under the age of 18 work part-time in entry-level positions. Since they're not earning much compared to other age ranges, they also have significantly smaller tax refunds. Those in the 18-to-25 range average more hours and higher pay, but they're still just starting out in their careers. Peak earnings generally occur anywhere from the mid-30s to the mid-50s.
Average tax refund by state
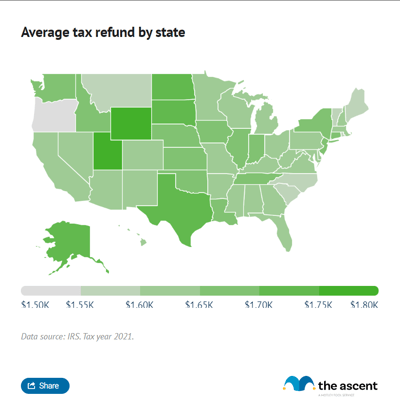
Florida residents received the largest average tax return in 2022, getting $1,994 back, while those from Idaho received the smallest average tax refund, getting just $1,370 back.
Most states estimate that state tax refunds are issued within 10 weeks.

FAQs: How to check your income tax refund status and more
Where is my tax refund?
Nine out of 10 tax refunds are issued within 21 days, according to the IRS.
The IRS "Where's My Refund?" tool provides information on your tax refund status. To access that information, you'll need your Social Security number, filing status, and refund amount, which can be copied from your tax return. It can take 24 hours after you file an electronic return to access a status update and up to four weeks if you file your refund on paper.
Many states offer similar tools to track state tax refunds. Most states estimate issue refunds within eight weeks.
Can I file for an extension on my taxes?
The IRS provides a six-month tax-filing extension if you need one; however, you must request an extension prior to the tax deadline. The extension applies only to filing your taxes -- if you owe money, you still need to pay by the original due date regardless of an extension.
What's the best tax refund software?
Check out The Ascent's recommendations for the best tax software. We've also recommended the best free tax software. These services help taxpayers navigate the filing process and seek out deductions and credits so filers get the largest return possible.
Methodology
To calculate the average tax refund amount by income, age, and marital status, we divided the total refunded overpayment amount by the number of returns. For state averages, we divided the individual income tax refund amounts listed for each state and divided by the number of returns. All amounts were rounded to two decimal places.
Sources
- Internal Revenue Service. "Filing Season Statistics for Week Ending March 24, 2023."
- Internal Revenue Service. "SOI Tax Stats - Individual Income Tax Returns Publication 1304 (Complete Report)," Table 1.3, Table 3.3, Table 3.7 (2023).
- Internal Revenue Service. "SOI Tax Stats - IRS Data Book Index of Tables," Table 7, Table 8 (2023).
Our Research Expert
We're firm believers in the Golden Rule, which is why editorial opinions are ours alone and have not been previously reviewed, approved, or endorsed by included advertisers. The Ascent does not cover all offers on the market. Editorial content from The Ascent is separate from The Motley Fool editorial content and is created by a different analyst team.