Personal Bankruptcy Statistics: Chapter 7 and Chapter 13
KEY POINTS
- Bankruptcy as a last resort: Personal bankruptcy allows debt liquidation and a fresh start, but harms credit scores.
- Increase in filings: Bankruptcy filings rose in 2024, with Chapter 7 making up 60% of cases.
- Income loss leads: Income loss is the primary bankruptcy driver, followed by medical-related reasons.
Personal bankruptcy -- including Chapter 7 and Chapter 13 bankruptcy -- is a last resort for consumers in financial distress, giving them a chance to liquidate their debts and get a fresh start.
Personal bankruptcy comes at a cost, both in what consumers pay to file bankruptcy and in the damage it does to their credit score. A balance transfer could be a smarter first move -- check out the best balance transfer cards to see if one fits your needs.
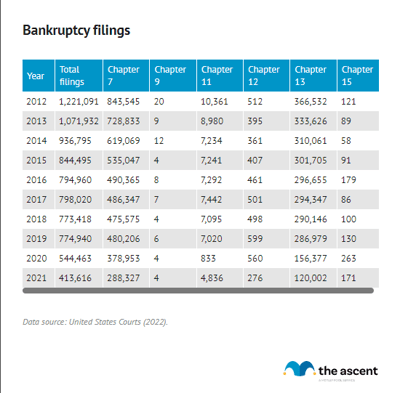
Bankruptcy filings were up in 2024 compared to the prior year, with 494,201 Americans filing versus 434,064 in 2023. Read on for more personal bankruptcy statistics.
Chapter 7 bankruptcy statistics
Chapter 7 personal bankruptcies -- also known as liquidation bankruptcy -- are the most common type of bankruptcy filed. Chapter 7 bankruptcy lets the debtor liquidate all nonexempt property and discharge their debts within three to six months
In 2024, 310,631 Americans filed for Chapter 7 bankruptcy, which accounts for 60% of all personal bankruptcies filed.
About 50,000 more Chapter 7 bankruptcies were filed in 2024 compared to 2023. 2024 was the third year in a row that more Americans filed for Chapter 7 bankruptcy.
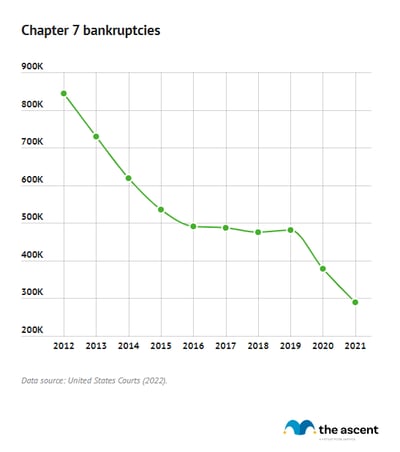
It's not surprising that Chapter 7 bankruptcies are the most common type of personal bankruptcies -- the debtor can complete the entire process in a matter of months instead of the years that other types of bankruptcy filings can take.
Chapter 13 bankruptcy statistics
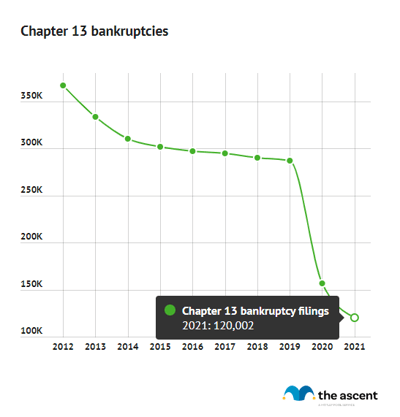
The second most common type of personal bankruptcies are Chapter 13 bankruptcies -- in which the debtor commits to a three- to five-year payment plan upon completion of which their remaining debts are discharged.
In 2024, 197,244 Americans filed for Chapter 13 bankruptcy, accounting for roughly 38% of all personal bankruptcy filings that year. There were about 13,000 more Chapter 13 bankruptcy filings in 2024 compared to 2023.
Chapter 11 bankruptcy statistics
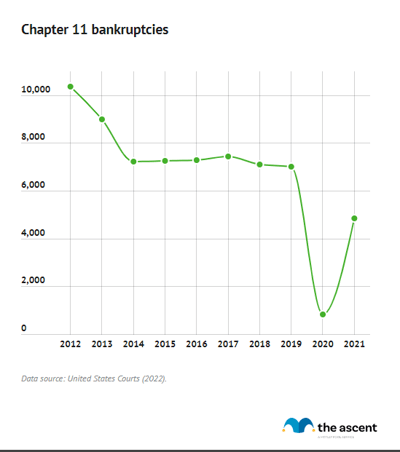
In 2024, 8,884 Chapter 11 bankruptcies were filed, an increase of roughly 1,400 from 2023.
In Chapter 11 bankruptcy filings, the debtor commits to a payment plan to repay a portion of their debts and discharge the rest, similar to a Chapter 13 bankruptcy filing (albeit more complicated and expensive). Debtors may elect to file for bankruptcy under Chapter 11 if their total debt exceeds the limits for Chapter 13 bankruptcy.
Bankruptcy filings by state
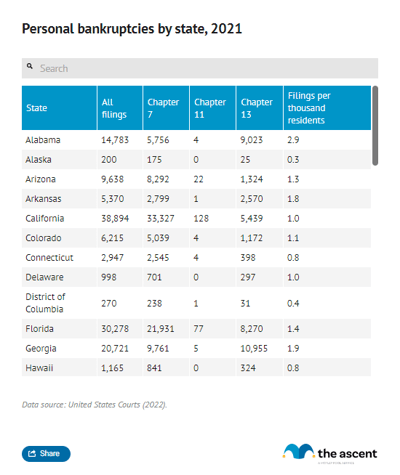
California, Florida, and Texas were home to the most personal bankruptcy filings in 2024. Not a huge surprise, given that those states are the most populous in the country.
The least number of personal bankruptcy filings occurred in Washington D.C, Vermont, and Alaska -- some of the least populous states.
Looking at filings per thousand residents, however, tells a different story. In Alabama, 3.7 personal bankruptcies were filed in 2024 for every thousand residents. Mississippi, Tennessee, Georgia, Nevada, Kentucky, Indiana, and Arkansas similarly had two or more bankruptcies filed per thousand residents.
On the other hand, Alaska had the lowest number of personal bankruptcies filed per thousand residents, just 0.2. The other states that had among the lowest personal bankruptcy filings per thousand residents: Vermont, Maine, Washington, D.C, and Montana.
Medical bankruptcy and other causes
Income loss is the leading driver of bankruptcy, cited by 78% of filers, followed closely by medical-related issues and family changes, which affected 72%, according to a survey of those who filed for bankruptcy between 2013 and 2016 published in the American Journal of Public Health.
Among those for which medical issues contributed to the circumstances that caused them to file for bankruptcy, medical expenses and the loss of work due to medical issues were the most common factors.
The usual recommendation on how much to save in an emergency fund is three to six months of living expenses. In our survey on Americans' financial habits, we found that only 15% felt confident they could go without six paychecks or more before missing financial obligations.
FAQs
-
Bankruptcy is a legal process to provide relief to people or other entities unable to repay debt. Filing for bankruptcy allows debtors to eliminate or reduce debt. It can have a significant negative impact on your credit score.
-
Declaring bankruptcy triggers an automatic stay, which prevents creditors from collecting assets from the debtor who has declared bankruptcy. This provides the party that has declared bankruptcy time to determine a course of action to repay their debts and some breathing room to deal with other financial obligations.
-
Three steps are required to file for bankruptcy. First, you must get credit counseling through an organization approved by the United States Courts. Second, you must file a bankruptcy petition, usually with the help of a lawyer. Third, you must meet with creditors following the acceptance of the bankruptcy petition.
-
Chapter 7 bankruptcy, often referred to as liquidation bankruptcy, allows the debtor to liquidate nonexempt property to pay off their debt and discharge the remainder of their debts within three to six months. Qualification for Chapter 7 bankruptcy is based on income. It is mostly used by those with low incomes. Chapter 7 bankruptcy appears on your credit report for 10 years.
Chapter 13 bankruptcy allows the debtor to propose and follow a three to five year repayment plan upon completion of which any remaining debts are discharged. There are limits to how much debt an individual can carry when filing under Chapter 13. Chapter 13 bankruptcy is more attractive than Chapter 7 bankruptcy because it allows debtors to prevent their homes from being foreclosed on as a result of bankruptcy. It also allows debtors to consolidate their debts. Chapter 13 bankruptcy appears on your credit report for seven years.
-
Filing for bankruptcy can severely impact your credit score for up to a decade, depending on which Chapter you file under. A lower credit score can make it more difficult to be approved for loans or receive favorable terms and can limit your ability to successfully apply for a credit card. That said, there are good credit card options after bankruptcy. Consumers also have ways to build credit after bankruptcy. There are even mortgage lenders that will work with those that have poor credit.
Under Chapter 7 bankruptcy, debtors may be required to liquidate nonexempt property, which includes assets that are not the "necessities of modern life." How that operates in practice is determined on a case-by-case basis and state law also plays a role in which property can be liquidated under Chapter. The bottom line is that debtors filing under Chapter 7 may lose some of their possessions.
-
Medical debt can be discharged through Chapter 7 or Chapter 13 bankruptcy. Medical debt is usually categorized as non-priority unsecured debt, which can be discharged through bankruptcy.
-
Chapter 7 bankruptcy stays on your credit report for 10 years. Chapter 13 bankruptcy stays on your credit report for seven years. Credit reports value recency, so it is possible to rebuild your credit score while bankruptcy appears on it as long as payments are made on time. Payments as part of a Chapter 13 bankruptcy repayment plan are also considered on credit reports.
-
Filing for Chapter 7 bankruptcy can typically cost between $2,910 to $3660, according to Nolo, a publisher of legal advice.
Filing for Chapter 7 bankruptcy requires a $338 filing fee, which can be waived depending on the filer's income.
Filers are required to attend two bankruptcy counseling sessions, which cost $60 or less.
Lawyers' fees are the most expensive part of filing for Chapter 7 bankruptcy. Most filers paid a fee of $1,450 to prepare the bankruptcy petition and represent them in court. Cases cost between $1,000 and $1,750. Those fees can vary even more widely depending on the firm and whether creditors challenge claims made in court, which would extend the case.
-
Sources
- American Journal of Public Health (2019). "Medical Bankruptcy: Still Common Despite the Affordable Care Act."
- Nolo. "Chapter 7 Bankruptcy: What Will It Cost and Will It Wipe Out My Debts?"
- U.S. Courts (2025). Table F-2— Bankruptcy Filings (December 31, 2024).
Our Research Expert
Jack Caporal is the Research Director for The Motley Fool and Motley Fool Money and has worked full-time for the company since 2021. Jack leads efforts to identify and analyze trends shaping investing and personal financial decisions across the United States. His research has appeared in thousands of media outlets including Harvard Business Review, The New York Times, Bloomberg, and CNBC, and has been cited in congressional testimony. He previously covered business and economic trends as a reporter and policy analyst in Washington, D.C. He serves as Chair of the Trade Policy Committee at the World Trade Center in Denver, Colorado. He holds a B.A. degree in International Relations with a concentration in International Economics from Michigan State University.
Motley Fool Stock Disclosures
The Motley Fool has a disclosure policy.