Personal Loan Statistics Heading Into 2026
KEY POINTS
- TransUnion reports a total of $276 billion in unsecured personal loan balances as of the fourth quarter of 2025, which is a record high.
- The average balance of an unsecured personal loan is $11,699.
- The most common reason for taking out a personal loan is to make paying off existing debt easier through consolidation or refinancing.
Unsecured personal loan debt hit a record $276 billion in the fourth quarter of 2025, with the average outstanding balance amounting to $11,699, according to the credit reporting agency TransUnion.
The record outstanding personal loan debt comes as the average interest rate on a 24-month personal loan from commercial banks rose to 11.65%.
Several factors influence personal loan balances and delinquency rates. They include a consumer's credit score, where they live, and the type of lender they choose.
Personal loans can help make a large purchase possible or can be used to strategically consolidate debt at a lower interest rate. If you're shopping for a personal loan, Motley Fool Money's experts have reviewed the best personal loans available.
Average personal loan debt heading into 2026
The average unsecured personal loan balance is $11,699 as of the fourth quarter of 2025, according to TransUnion. When borrowers open a new account, the average balance is $6,700.
Average debt per borrower peaked in the first quarter of 2024 at $11,829. The average new account balance peaked a year prior at $8,200.
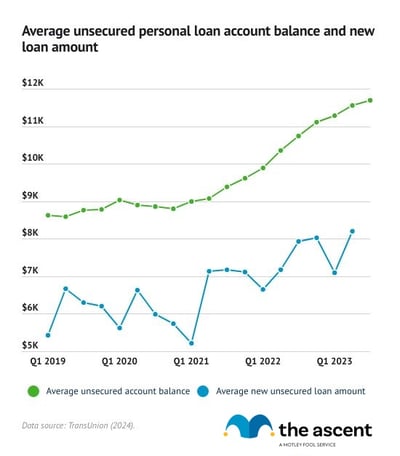
The last three quarters of 2022 saw the fastest growth in average account balances and new loan amounts since at least 2019. Many pandemic-era benefit programs wound down during that time, putting stress on wallets across the country.
Total unsecured personal loan debt balance
The overall personal loan debt in the United States stands at a record $276 billion as of the fourth quarter of 2025.
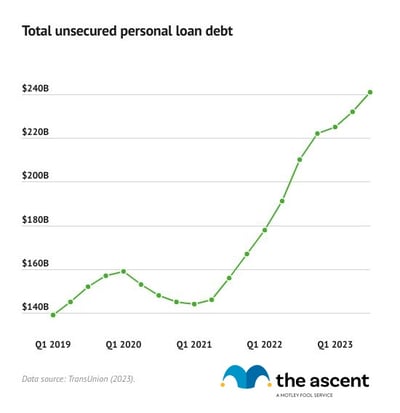
Similar to the average account balance, total personal loan debt accumulated rapidly during 2022, though it slowed in 2023. This follows a decline in outstanding personal loan debt in 2020 and the first quarter of 2021, as pandemic aid provided financial relief to Americans.
Personal loan delinquency rates
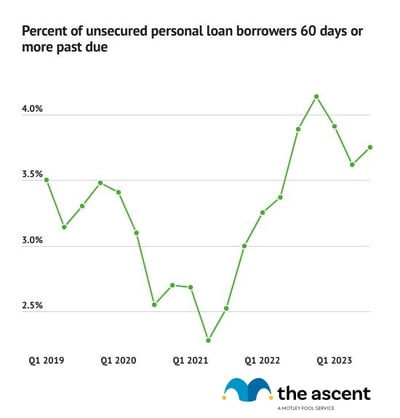
The percentage of personal loan borrowers who are 60 days or more past due rose to 4% in the fourth quarter of 2025, from 3.5% in the previous quarter.
Delinquencies decreased during the pandemic, likely due to stimulus and other financial relief measures. The rise in delinquencies coincided with the expiration of those measures. The percentage of borrowers who are delinquent stabilized in 2023 and 2024, and rose in 2025.
Average personal loan interest rates
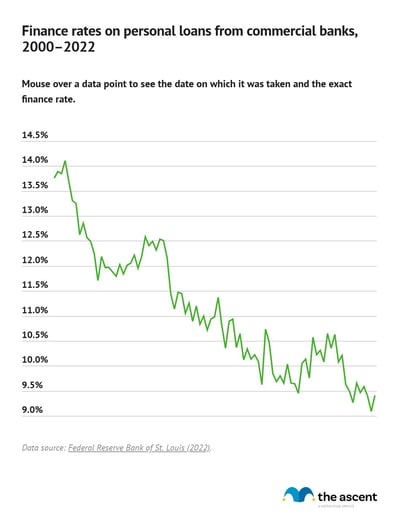
The average interest rate on a 24-month personal loan from a commercial bank was 11.65% as of November 2025.
Interest rates hung around 9% to 11% from 2011 to mid-2022. They rose to 12.5% in February 2024 and have see-sawed since.
Interest rates can vary depending on credit history. The best rates are generally reserved for consumers with a credit score of 720 or higher. Taking steps to increase your credit score can yield better interest rates on personal loans. (Improving your score will also make you more likely to get approved for credit cards and other financial products.)
Rates also depend on the lender. That's why consumers should rate-shop and choose the lender that offers the best deal.
Payday loans often have extremely high interest rates and should be avoided.
Personal loans by credit score
Consumers with lower credit scores have increased their personal loan debt over the last year. TransUnion measures the portion of outstanding personal loan balances tied to consumers in each credit range. It uses the following ranges in the VantageScore 4.0 system:
- Super prime (781-850)
- Prime plus (721-780)
- Prime (661-720)
- Near prime (601-660)
- Subprime (300-600)
Those with prime, near-prime, and subprime credit scores account for 74% of personal loan debt. Among those three, each credit score group has roughly the same amount of debt.
Americans with super prime credit scores account for the lowest percentage of personal loan debt, despite carrying the highest average balances and taking out the largest loans.
| Credit Range | % of Personal Loan Debt, Jan. 2026 | % of Personal Loan Debt, Jan. 2025 |
|---|---|---|
| Super prime | 13% | 13% |
| Prime plus | 14% | 15% |
| Prime | 21% | 22% |
| Near prime | 25% | 25% |
| Subprime | 28% | 27% |
Loan amounts are strongly correlated with borrowers' credit scores. Consumers with higher credit scores take out larger loans and have higher outstanding balances.
| Credit Range | Average Balance, Jan. 2026 | Average Balance, Jan. 2025 |
|---|---|---|
| Super prime | $17,577 | $17,197 |
| Prime plus | $16,811 | $16,235 |
| Prime | $13,249 | $12,822 |
| Near prime | $9,376 | $9,124 |
| Subprime | $5,705 | $5,921 |
| All | $11,690 | $11,608 |
Delinquency rates by credit score
Delinquency rates are significantly higher for borrowers with lower credit scores, which explains why those scores play a crucial role in determining loan interest rates. Hardly any borrowers in the prime credit score range were 60 days or more delinquent on a loan, compared with 15% in the subprime group.
| Credit Range | % Borrowers 60+ DPD, Jan. 2026 | % Borrowers 60+ DPD, Jan. 2025 |
|---|---|---|
| Super prime | 0.01% | 0% |
| Prime plus | 0.01% | 0.01% |
| Prime | 0.15% | 0.14% |
| Near prime | 1.15% | 1.14% |
| Subprime | 15.02% | 14.57% |
| Total | 4.10% | 3.69% |
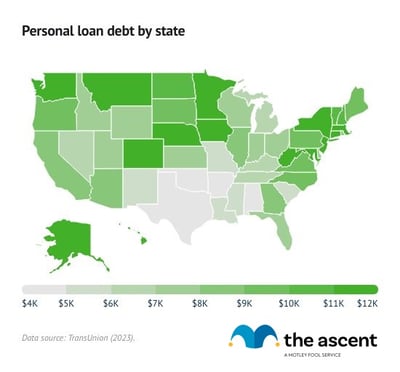
Personal loan statistics by state
Personal loan balances and delinquency rates vary significantly by state. Many states with high average new loan amounts have low delinquency rates, while others with low average new loan amounts have high delinquency rates.
Massachusetts has the highest average new personal loan account balance at $11,505, as of November 2025.
Oklahoma has the lowest average new account balance at $3,010 and the highest delinquency rate at 7.15%.
Personal loan statistics by age
Personal loan balances vary by generation, with baby boomers holding the most outstanding personal loan debt on average, $22,551, and Gen Z holding the least, $8,710, as of the third quarter of 2023.
All generations added more to their average personal loan balances from 2022 to 2023. Gen Z saw the largest percentage increase, while Gen X's average personal loan balance grew the most.
That's according to the credit reporting company Experian.
| Generation | 2021 | 2022 | 2023 |
|---|---|---|---|
| Generation Z (18-25) | $6,658 | $7,684 | $8,710 |
| Millennials (26-41) | $13,418 | $15,101 | $16,669 |
| Generation X (42-57) | $18,922 | $20,677 | $22,259 |
| Baby boomers (58-76) | $20,370 | $21,644 | $22,551 |
| Silent generation (77+) | $17,334 | $18,211 | $18,547 |
Personal loan statistics by type of lender
Options abound for consumers seeking to borrow money. Banks and credit unions are traditional choices, but fintech companies and finance companies also offer loans for specific purchases.
Fintech companies now service more unsecured personal loan debt than banks and credit unions combined.
| Type of Lender | Percentage of Personal Loan Debt, Sept. 2025 | Percentage of Personal Loan Debt, Sept. 2024 |
|---|---|---|
| Fintech | 51% | 49% |
| Bank | 21% | 22% |
| Credit union | 19% | 20% |
| Finance company | 8% | 8% |
Loan amount, account balance, and delinquency rates by type of lender
Delinquency is a more significant issue for finance companies than for other types of personal loan providers. Even though they lend smaller amounts, their rate of past due accounts is higher than fintech companies, credit unions, and banks.
Banks provide the largest loans, on average, followed by fintech companies, credit unions, and finance companies. Individuals with personal loan accounts at fintech companies have the highest average outstanding balances compared to those who borrowed from other personal loan providers.
| Lender Type | Avg. New Loan Amount, Nov. 2025 | Avg. Account Balance, Jan. 2026 | % Borrowers 60+ DPD, Jan. 2026 |
|---|---|---|---|
| Bank | $9,343 | $12,613 | 1.31% |
| Credit Union | $5,750 | $8,349 | 2.04% |
| Finance Company | $2,501 | $4,731 | 7.50% |
| FinTech | $7,825 | $13,148 | 3.36% |
| Other | $6,365 | $9,358 | 9.80% |
| Total | $6,062 | $11,690 | 3.59% |
Why do Americans take out personal loans?
The most common reason Americans take out personal loans is to better manage debt, including through debt consolidation or refinancing. That's according to data collected by LendingTree in 2023 and a 2022 J.D. Power survey.
According to LendingTree, 35% of those who took out a personal loan did so to consolidate their debt, and 16% did so to refinance their credit card balances.
Among those surveyed by J.D. Power, the three top-cited reasons for taking out a personal loan were to consolidate debt, get a lower interest rate on outstanding debt, and lower their monthly debt payments.
The best debt consolidation loans offer interest rates below credit card rates, depending on the borrower's credit score. However, for those with credit card debt, a balance transfer card is another option.
Recent trends in personal loans
The biggest trend in the personal loan industry remains increased borrowing. Loan originations plummeted during the pandemic as lenders were reluctant to approve applications, while average individual balances shrank.
That changed in the second half of 2021. Now, overall outstanding personal loan debt, the number of personal loans, and the number of consumers with personal loans are at record highs. Average debt per borrower and average account balances are at off-peak levels but still near record highs.
That's despite the average interest rate on personal loans from banks remaining somewhat elevated. While there are some signs that the increase in personal loan balances is slowing from the fast pace in 2022, economic conditions remain tough and uncertain for many Americans.
The best personal loans offer a wide range of loan amounts and interest rates, the latter of which is heavily dependent on the borrower's credit score.
Credit cards with a 0% intro APR promotional period can sometimes serve as an alternative to a personal loan without accruing any interest if the borrower completely pays off their balance while in the promotional period.
Still, with interest rates elevated, there are few good options for families in a pinch.
-
Sources
- Board of Governors of the Federal Reserve System (2025). "Finance Rate on Personal Loans at Commercial Banks, 24 Month Loan."
- Experian (2024). "Experian Study: Average U.S. Consumer Debt and Statistics."
- J.D. Power (2022). "Personal Loans Emerge as Critical Financial Lifeline in Challenging Economy, J.D. Power Finds."
- LendingTree (2023). "Personal Loan Statistics: 2023."
- TransUnion (2026). "Credit Industry Snapshot"
- TransUnion (2026). "TransUnion 2026 Originations Forecast Shows Continued Positive Momentum Amidst Moderate Expansion."
- ZDNet (2022). "38% of vulnerable consumers have used a personal loan: J.D. Power survey."
Our Research Expert
Jack Caporal is the Research Director for The Motley Fool and Motley Fool Money and has worked full-time for the company since 2021. Jack leads efforts to identify and analyze trends shaping investing and personal financial decisions across the United States. His research has appeared in thousands of media outlets including Harvard Business Review, The New York Times, Bloomberg, and CNBC, and has been cited in congressional testimony. He previously covered business and economic trends as a reporter and policy analyst in Washington, D.C. He serves as Chair of the Trade Policy Committee at the World Trade Center in Denver, Colorado. He holds a B.A. degree in International Relations with a concentration in International Economics from Michigan State University.
Motley Fool Stock Disclosures
The Motley Fool has a disclosure policy.