
By now most investors will know that General Electric (GE 1.30%) stock rose by a double-digit percentage on the day of its fourth-quarter 2019 results, but the question is why did it do so? Moreover, is the reason behind the rise also going to carry forward into 2020? Let's take a look at what's going on.
Cash flow is key
GE's industrial free cash flow (FCF) generation has been central to the bull-and-bear debate in recent years. The bear case usually involves pointing out GE's anemic FCF generation and then comparing it with the price-to-FCF multiples of industrial peers like United Technologies, Siemens, and Honeywell, the rationale being that industrial conglomerates should have a diverse set of businesses generating earnings and cash flow throughout the cycle. On this basis, GE is a very expensive stock in which to invest.
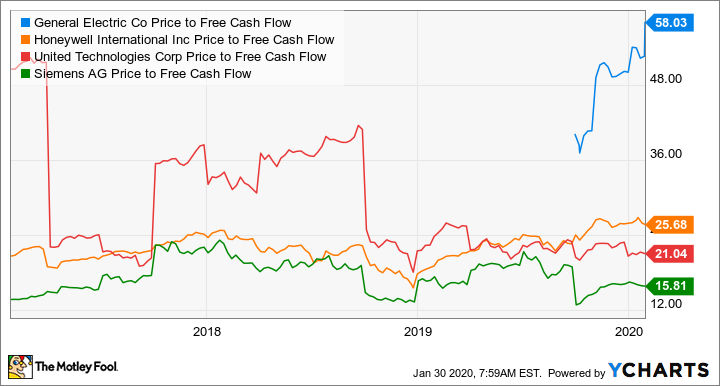
GE Price to Free Cash Flow data by YCharts.
On the other hand, the bull case argues that GE is in turnaround mode and FCF will improve noticeably in the future. Whichever way you look at it, FCF generation over the near and long term is a critical part of how you should value a stock.

Image source: Getty Images.
Here's the good news from General Electric
Investors can disagree on the question of whether CEO Larry Culp deliberately lowballed FCF guidance when he took over the office, but what's indisputable is that GE sailed past the company's original guidance.
Now let's take a look at GE's FCF outlook through 2019 and the recently given outlook for 2020. Take a moment to look at the headline numbers because the underlying numbers are much better than what's on display.
For now, note that the 2019 figure of $2.3 billion came in much better than the original outlook for an outflow of $2 billion to zero, and the outlook given in October. Moreover, the forecast for 2020 of $2 billion to $4 billion shows a clear improvement on the $2.3 billion generated in 2019.
| Metric |
Current Outlook Full-Year 2020 |
Full-Year 2019 Actual |
Updated Outlook (Given in October 2019) |
Initial Full-Year 2019 Outlook (Given in March 2019) |
Full-Year 2018 Actual |
|---|---|---|---|---|---|
|
Industrial free cash flow |
$2 billion to $4 billion |
$2.3 billion |
$0 to $2 billion |
$(2) billion to $0 |
$4.3 billion |
Data source: General Electric presentations.
Why the underlying numbers are even better
Now let's get into the nuance. First, starting with the 2019 figure of $2.3 billion, it's important to note that the grounding of the Boeing 737 MAX and subsequent production halt hit GE's FCF by $1.4 billion in 2019. CFM International, GE's joint venture with Safran, makes the LEAP engine for the aircraft. This is not something management could have predicted when it gave its initial guidance in March 2019. In other words, it's fair to assume that the apples-to-apples FCF figure for 2019 is $3.7 billion -- significantly ahead of the midpoint of initial guidance for an outflow of $1 billion.
Second, the 2020 outlook implies a much more significant jump in FCF from 2019 than the headline numbers outline. This is because the 2019 figure contains $1.3 billion of FCF from biopharma -- a business that GE will sell to Danaher in early 2020 -- and $350 million in dividends from GE's stake in Baker Hughes. GE plans to gradually sell off this stake in 2020.
In addition, GE's FCF guidance for 2020 "is dependent on the 737 MAX return to service, which we are planning for mid-2020," according to Culp on the latest earnings call.
Let's try to crystallize what all these numbers mean. As you can see below, stripping out biopharma free cash flow and Baker Hughes dividends (as they won't be in 2020 for a full year) and adding back the $1.4 billion headwind from the 737 MAX gives an adjusted figure of $2.05 billion for 2019.
|
Adjustment |
2019 Industrial Free Cash Flow |
|---|---|
|
Reported full year |
$2.3 billion |
|
Minus biopharma free cash flow |
($1.3 billion) |
|
Minus Baker Hughes dividend |
($350 million) |
|
Plus 737 MAX cash headwind |
$1.4 billion |
|
Adjusted underlying industrial free cash flow |
$2.05 billion |
Data source: General Electric. Author's analysis.
Now recall that GE's FCF guidance for 2020 of $2 billion to $4 billion assumes the 737 MAX won't return to service before the middle of the year. In addition, it doesn't contain a full year of FCF from biopharma or a full year of dividends from Baker Hughes. Moreover, it's fair to say that the 2020 outlook is significantly lower than what it would be if the 737 MAX was in full production.
The upshot of all of this is that if the 737 MAX was in full production, then GE's FCF in 2020 would have been a lot stronger than the $2 billion to $4 billion guided to, and that figure is likely to be a significant jump on the apples-to-apples comparison of $2.05 billion calculated in the table.
Valuing General Electric
Analysts asked the key question of what GE's FCF in 2020 could look like assuming the 737 MAX was in full production, with Culp replying it was "very, very hard to tell." However, he also promised more color on FCF guidance in a forthcoming update in March.
Nevertheless, based on the fact that the headwind in 2019 from the 737 MAX was $1.4 billion, a back-of-envelope figure for GE's underlying FCF could add $1 billion or $2 billion (assuming the 737 MAX was in full production and being delivered) to the range of $2 billion to $4 billion, with more growth in 2021 as its power segment continues to improve and LEAP engine production increases.
All told, it's not hard to pencil in GE generating at least $5 billion in FCF in 2021, and based on the current market cap, that would put GE on a 2021 price-to-FCF multiple of around 22 times -- a figure comparable to that of Honeywell and United Technologies right now. There's no doubt about it, GE's FCF looks set to expand significantly in the coming years, and that's what's supporting the recent stock price move.


