
2022 was a historic year for the markets -- and not in a good way. Post-pandemic inflation, war in Europe, and widespread lockdowns in China were just a few of the problems that plagued all financial assets last year.
And while there have been much worse drawdowns in the S&P 500 index (^GSPC 1.02%) in recent years, 2022 may go down as one of the worst years in investing history when combining the stock market decline with those in other types of financial assets.
The worst bond market year ever
Many investors, especially those in retirement, generally don't just own stocks but usually have some portion of their portfolios in fixed income as well. Fixed income is a fairly broad term, but many investors in the equity market, which has exposure to the health of corporations, choose to balance their equity holdings with longer-dated U.S. Treasury bonds.
Why Treasuries? Because Treasury bonds are backed by the full faith and credit of the U.S. government, which has the power to levy taxes. In periods of market distress and uncertainty over corporate earnings, U.S. Treasuries are seen as a "safe haven" asset. In historic recession scenarios, investors usually buy up Treasuries, as their required "risk-free" yield goes down in anticipation of lower economic growth.
So, the thinking behind a standard 60/40 portfolio asset allocation is that when stocks decline due to recession, the value of U.S. Treasuries would go up, lowering the portfolio's overall volatility. This is what happened in the 2008 market crash; stocks plummeted 37%, but the return of 10-year U.S. Treasuries was a positive 20.1%, leading to just a 14.2% decline for 60/40 portfolios.
But 2022 was no ordinary downturn
However, 2022 was a strange year. Long-dated U.S. Treasury bonds came into 2022 at historically low yields, with the 10-year Treasury bond yield entering the year at just 1.51%. As a result of last year's inflation burst, 10-year rates spiked throughout 2022, eventually rising well above 4% before ending the year at 3.88%.
As such, the rise in interest rates actually caused the value of 10-year bonds to fall in 2022. But 10-year Treasury bonds didn't just fall in 2022 -- they plunged 17.8%! That's actually the worst performance for the 10-year Treasury in recorded history. And 30-year U.S. Treasuries lost a whopping 39.2% -- a record low performance for U.S. bonds dating back to when data was first collected in 1754 -- before the American Revolution!
Now that's a bad year.
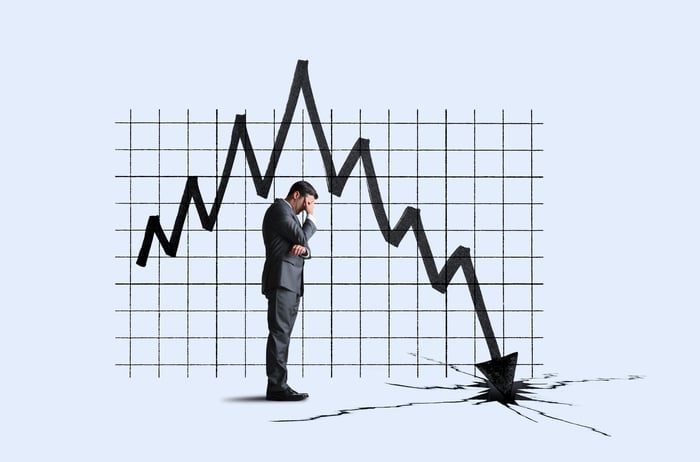
Image source: Getty Images.
The bond rout led to the worst returns for a 60/40 portfolio since 1937
While the S&P 500's 18.1% decline was painful, it was only the fourth-worst stock market year in the last 50, only half as bad as the 37% decline in 2008, and better than the 22.1% decline in 2002 and 25.9% decline in 1974. Yet in each of those modern stock market routs, the value of 10-year Treasuries rose in conjunction, balancing out the losses in the stock market.
However, those who were trying to limit volatility in a 60/40 portfolio in 2022 had a total loss of 18%. That was the worst performance for the 60/40 portfolio dating back to 1937 when the 60/40 portfolio declined 20.7%, and the third worst in modern history. (The worst was in 1931, with its 27.3% decline.)
Both of those instances were during the Great Depression.
When both stocks and bonds decline, here's what happens next
Since 1928, there have been only four other years in which both the S&P 500 and the 10-year Treasury bond each fell in value.
So how do these assets usually perform the following year? Fortunately, the record looks pretty good:
|
S&P 500 |
10-Year Treasury |
S&P 500 Following Year Performance |
10-Year Treasury Bond Following Year Performance |
|
|---|---|---|---|---|
|
1931 |
(43.8%) |
(2.6%) |
(8.6%) |
8.8% |
|
1941 |
(12.8%) |
(2%) |
19.2% |
2.3% |
|
1969 |
(8.2%) |
(5%) |
3.6% |
16.8% |
|
2018 |
(4.4%) |
(0%) |
31.5% |
9.6% |
|
2022 |
(18.1%) |
(17.8%) |
? |
? |
Data source: bilello.blog and nyu.edu. Chart by author.
In three of those four years, the S&P 500 was positive the following year, with the only exception being 1932, at the height of the Great Depression. And in four out of four years, the 10-year Treasury was positive the following year.
However, before we break out the champagne, it should be noted that four years is a very small sample size. And given that 2022 was the first time both asset classes declined by double digits, we are in rarefied territory, without easy comparisons.

Image source: Getty Images.
Could this be 1974 or 2002?
In general, bad performance in one asset class one year tends to lead to better performance the following year, and that is reason for optimism. In the post-WWII era, the S&P 500 has declined 17 times, including 2022. Out of those 17, the market has only logged back-to-back losses twice, or three times if one counts the 2000 to 2002 period when the market declined three years in a row.
Unfortunately, the 2022 market decline had similarities to both of those periods. In the 1970s, inflation ran rampant, and the problem was compounded by the OPEC oil embargo after the 1973 Yom Kippur War. Meanwhile, the 2000 to 2002 multiyear downturn included the tech internet bubble bursting, followed by the Sept. 11 attacks in 2001.
Like 2000, 2022 saw a highly valued technology sector sell off severely. And like 1973, oil prices spiked due to geopolitical events, this time following Russia's invasion of Ukraine.
Yet on the brighter side, inflation has been on the decline for the last few months, with a still-resilient job market. Fuel prices have also come down from their highs. Absent a new shock, the market could very well recover in 2023. Yet with the Russia-Ukraine war still ongoing, much uncertainty remains. Should another geopolitical event throw a wrench in the market recovery, it's possible another back-to-back decline could await the market.
But don't let fear keep you out of the market
It's important to maintain perspective; over the long term, the stock market is the best asset class to maintain one's purchasing power, along with real returns above inflation. Even if you had invested in 1972, the year before the massive 1973 to 1974 decline in a period of high inflation, your annualized returns would have still been 9.4% over 50 years, with 5.4% real returns above inflation.
That's a healthy reminder to stick to your long-term investing plan even amid the high market volatility and uncertainty. The timing of a recovery is uncertain, but it should come eventually. And it should be worth the wait.


