The trade deficit is a pretty simple concept: The U.S. imports more goods and services than it exports. The gap between the two (the deficit) is essentially exporting dollars out of the U.S., which over time leads to all sorts of fun effects, like a weak dollar.
Still with me? Good. The Commerce Department released numbers for July's trade deficit, and they aren't pretty -- $62.2 billion for the month, reflecting imports of $230.3 billion versus $168.1 billion in exports. The reading was the highest deficit in 16 months.
What drove the deficit? The price of oil, of course. July marked a peak in oil prices, topping out at nearly $150 a barrel at one point. For comparison's sake, I included the increase in the price of oil over the past 8 years next to the increase in the trade deficit.
Have a look:
|
Year |
Trade Deficit (in billions) |
Trade Deficit Growth |
Crude Oil Price Growth |
|---|---|---|---|
|
2000 |
$379.84 |
43.29% |
65.40% |
|
2001 |
$365.13 |
(3.87%) |
(16.03%) |
|
2002 |
$423.73 |
16.05% |
(0.83%) |
|
2003 |
$496.92 |
17.27% |
21.39% |
|
2004 |
$607.73 |
22.30% |
36.01% |
|
2005 |
$711.57 |
17.09% |
32.87% |
|
2006 |
$753.28 |
5.86% |
16.51% |
|
2007 |
$700.26 |
(7.04%) |
10.12% |
|
2008* |
$719.76 |
2.78% |
52.34% |
*Through July, annualized
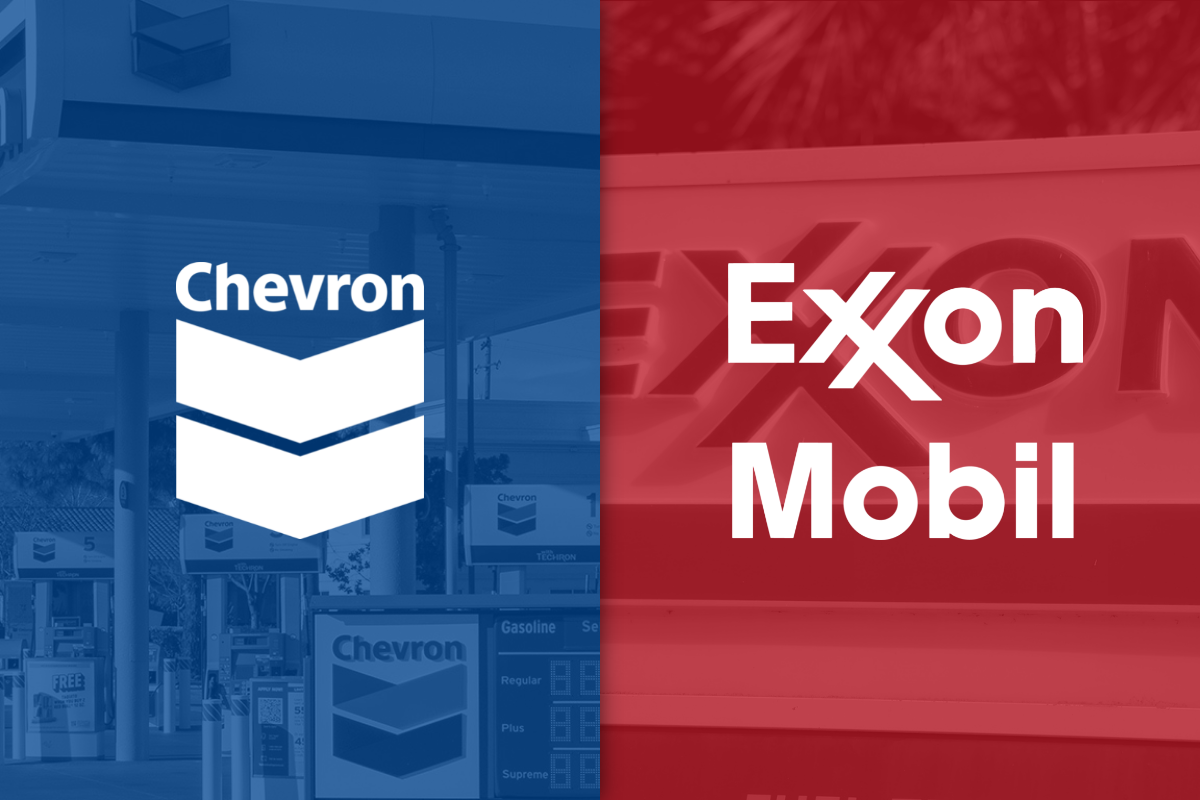
Don't try to find a correlation between oil price gains and trade deficit gains: The relationship shouldn't be perfect. What it does show is that rising price of crude over the years has played a significant role in the nation's trade deficit: great for ExxonMobil (NYSE:XOM) and Chevron (NYSE:CVX), bad for consumers at the pump.
Another notable development from the recent deficit report includes a 3.3% jump in exports over June, with gains in industrial supplies, capital goods, consumer goods, and autos. Mark that down as a net positive for the likes of General Motors (NYSE:GM), Ford (NYSE:F), Procter & Gamble (NYSE:PG), and Nucor (NYSE:NUE). And be thankful -- anytime you can muster the words "net positive" these days, it’s a real treat.
For more on macroeconomic matters, check out:
- Why the slide in the value of the dollar isn't over yet.
- How to profit from a falling dollar.
- Sick of inflation? Learn how to stop Bernanke from swiping your savings.