American Households' Average Monthly Expenses: $6,545
KEY POINTS
- The average household's monthly expenses are $6,545 ($78,535 over the entire year), up from $6,440 ($77,280 over the entire year) in 2023.
- Housing is the largest average expense at $2,189 per month, making up 33% of typical spending.
- Transportation is the second-largest expense, costing $1,110 per month, which accounts for approximately 17% of overall spending.
The average American household spends $6,545 per month, according to the latest Consumer Expenditure Survey from the U.S. Bureau of Labor Statistics (BLS).
That's a $105 increase from average monthly household spending in 2023 and a $2,286 increase from 2013.
The allocation of Americans' spending between food, housing, and other major expenses remained consistent from 2023 to 2024. Spending on housing, food, and transportation increased slightly, while retirement contributions and expenditures on clothing and entertainment decreased.
Understanding how the typical household budget is allocated can provide a benchmark for comparing your own spending habits.
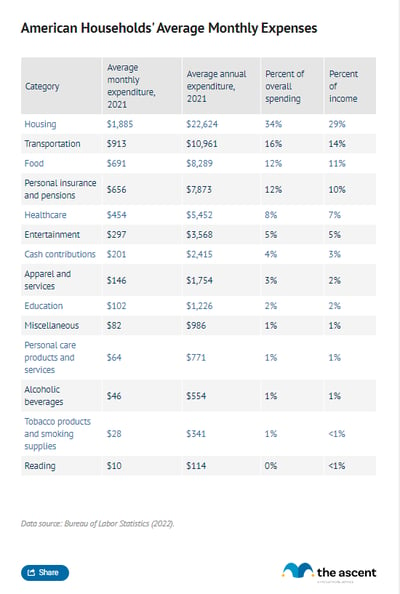
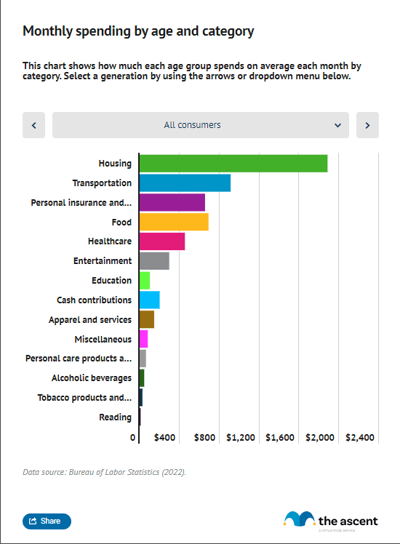
Table: Average monthly spending by category
How much does the average household spend per month?
The average monthly household expenses in 2024 were $6,545. The average spending for the entire year totaled $78,535.
Average expenses can vary by region -- some cities are cheaper to live in and others are more expensive. The figures presented in this article are national averages.
Average spending grew 2% from 2023 to 2024. That's a slowdown from the previous year, when spending grew 6%.
BLS tracks spending by consumer unit, which it defines as any of the following:
- Families
- Single persons living alone
- Single persons sharing a household with others but who are financially independent
- Two or more people living together and sharing major expenses
For example, a family consisting of two parents and a child would be considered one consumer unit. Three roommates would be three consumer units. The average consumer unit consists of 2.5 people, with an average age of 52.
The BLS survey only calculates annual spending, so we divided those numbers by 12 to get the average household expenses per month. Because we rounded to the nearest dollar, there may be small discrepancies when comparing the monthly and annual numbers.
Not all typical expenses occur on a monthly basis. Many expenses are intermittent, like car repairs, buying textbooks, or spending on a new TV. For example, most people aren't spending $301 per month on entertainment. But over the course of the year, entertainment spending averages $3,609.
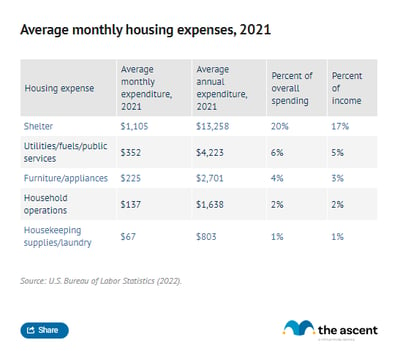
Average monthly spending on housing: $2,189 (3% increase)
Housing is by far the largest expense for Americans. Monthly housing expenses in 2024 averaged $2,189, a 3% increase from 2023. Over the course of the entire year, Americans spent an average of $26,266 on housing.
Of the $2,189 Americans spend on housing each month, $1,360 of it goes toward housing payments, like a mortgage or rent. That amount can change significantly depending on location, house size, and whether a person has roommates.
Here's a more detailed breakdown of the different expenses of homeownership and how much Americans spend in each category.
Average monthly spending on transportation: $1,110 (3% increase)
Americans spent $1,110 per month on transportation in 2024, totaling $ 13,318 over the full year.
Transportation is the second-largest monthly expenditure. Spending on transportation was up 1% in 2024 compared to 2023.
Transportation expenses are spread out, but add up to be significant over the course of a year. Maintenance and repairs, for example, aren't generally monthly expenses, yet amounted to $984 on average over the entire course of 2024.
People don't usually buy a new car every year, but when they do, it's a major purchase. Depending on the payment schedule you choose, auto insurance could be a monthly expense or one that you pay twice a year.
Americans spent less on vehicle purchases in 2024 compared to 2023, but more on insurance, finance charges, leases, and other associated fees.
Spending on gas decreased by 2% year over year, following a 14% decline in 2023, as fuel prices remained low. Public transportation expenditures rose for the third consecutive year, continuing their recovery from a low point in 2020.

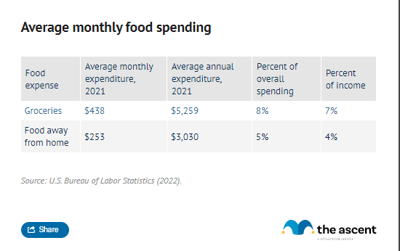
Average monthly food spending: $847 (2% increase)
Food spending includes groceries and food away from home, which refers to any food that you pay someone else to prepare for you, such as when eating at a restaurant or ordering delivery. Average food spending increased 2% from 2023 to 2024. On average, Americans spent $847 per month on food in 2023, totaling $10,196 for the full year.
Spending on food includes groceries and eating out. Americans spent an average of $519 per month on groceries in 2024, up 3% from the previous year, and $329 per month on dining out, essentially unchanged from 2023.
Food prices, particularly grocery prices, experienced relatively high inflation during certain periods over the last four years. If you've seen your own supermarket spending increase, a grocery credit card could help you save on costs.
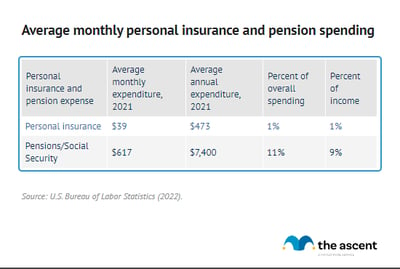
Average monthly personal insurance and pension spending: $816 (3% increase)
Personal insurance and pensions accounted for $816 in monthly spending in 2024 and $9,797 over the full year, a 3% increase from 2023.
This category includes life insurance, personal liability insurance, accident insurance, and disability insurance. It doesn't include homeowners insurance or renters insurance, which are part of housing costs, or auto insurance, which is part of transportation.
Only 6% of spending in this category is allocated toward personal insurance. The remaining 94% goes to pensions and Social Security. That includes contributions to retirement accounts and the Social Security benefits withheld from paychecks.
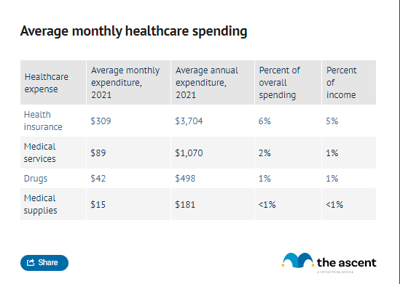
Average monthly healthcare spending: $516 (1% increase)
The average monthly healthcare spending in 2024 was $516, a 1% increase from 2023.
In 2024, 65% of healthcare spending went toward health insurance premiums, which averaged $338 per month.
Spending on drugs increased 11% year over year. In 2023, Americans spent an average of $591 per month, while in 2024, they spent an average of $658.
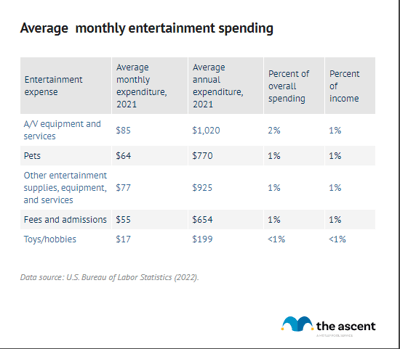
Average monthly spending on entertainment: $301 (1% decrease)
Americans spent 5% of their monthly budgets on entertainment in 2024, totaling $301 per month and $3,609 for the entire year. That's down 1% from 2023.
BLS made some interesting decisions in what was and wasn't considered entertainment. As entertaining as pets can be, pet owners would probably argue that they deserve their own category. Avid readers may be surprised to learn that reading doesn't fall under entertainment (it has its own category instead).
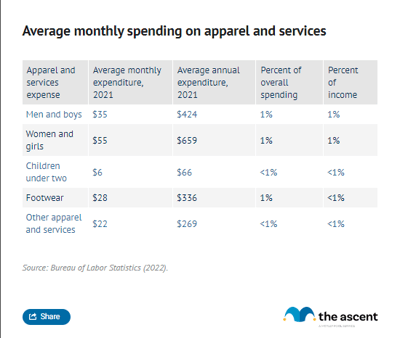
Average monthly spending on apparel and services: $167 (2% decrease)
Apparel spending fell for the first time since 2020, when Americans were spending less time in social situations due to the pandemic. Americans spent an average of $167 per month on apparel and related services in 2024, totaling $2,001 for the year, a 2% decrease from 2023.
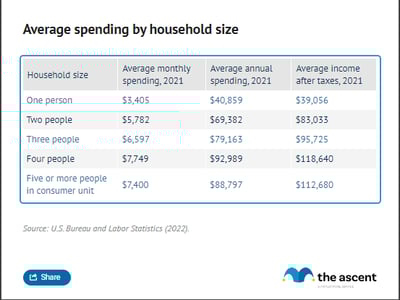
Average monthly expenses by household size
Average monthly spending can vary by household size, and data show that, although one-person households spent significantly less than all other households in 2023, they were the only group to spend more than their after-tax income.
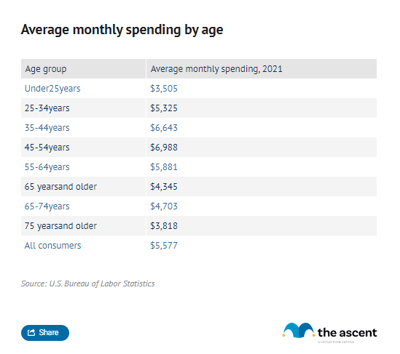
Average monthly spending by age
Americans between 45 and 54 years old spent $8,361 on average per month in 2024, the most out of any age group. Americans aged 35 to 44 years old spent a few hundred dollars less, at $7,602.
Americans under 25 years old spent the least, with their average monthly expenses in 2024 coming out to $3,940. Their spending was closest to Americans at the other end of the age spectrum -- those over 75 years old spent $4,653 on average per month..
No age group spent more than their pre-tax income, although those 75 and older and 25 and younger came very close.
It's no surprise that Americans toward the middle of the age range are spending the most per month. That segment of the population is likely to earn the most money while also assuming significant financial responsibilities, such as raising children and paying off auto and home loans. As Americans reach retirement age, their spending and income levels decline rapidly.
How do your average monthly expenses compare?
It's interesting to see what the typical American spending habits look like and compare them to your own. Maybe you find that you spend similar portions of your monthly income in each category, or your spending patterns could be completely different.
Neither is it a good or a bad thing on its own. We all have different things we value and different areas where we're willing to spend more money. If you're satisfied with your spending habits and feel financially secure, that's what's most important.
If you're not able to save as much money as you'd like, then it's a good idea to reevaluate your typical spending and your budget. Whether it's dining out, entertainment, or something else, there may be an area where you're spending more than you realize and can cut back.
-
Sources
- U.S. Bureau of Labor Statistics (2025). "2024 Consumer Expenditure Survey."
Our Research Expert
Jack Caporal is the Research Director for The Motley Fool and Motley Fool Money and has worked full-time for the company since 2021. Jack leads efforts to identify and analyze trends shaping investing and personal financial decisions across the United States. His research has appeared in thousands of media outlets including Harvard Business Review, The New York Times, Bloomberg, and CNBC, and has been cited in congressional testimony. He previously covered business and economic trends as a reporter and policy analyst in Washington, D.C. He serves as Chair of the Trade Policy Committee at the World Trade Center in Denver, Colorado. He holds a B.A. degree in International Relations with a concentration in International Economics from Michigan State University.