How Many Cars Are in the U.S.? Car Ownership Statistics for 2025
KEY POINTS
- Car ownership increase: In 2024, 91.5% of U.S. households owned a vehicle, up from 90.9% in 2015.
- Truck dominance: Trucks are the most common vehicle type in the U.S., despite higher insurance costs.
- State variability: Car ownership rates vary by state, with Idaho at 96% and Washington, D.C. at 64%.
Car ownership rates are ticking upwards in the United States. According to the U.S. Census Bureau, 91.5% of U.S. households had at least one vehicle available in 2024, compared to 90.9% in 2015.
The United States consistently ranks near the top in terms of car ownership, and in several states, at least 95% of households have access to a vehicle. There are, however, a few areas with more robust public transportation systems that buck the norm, including Washington, D.C., New York, and New Jersey.
Read on to find out where your state ranked, the total number of vehicles in the country, and more of the latest car ownership statistics.
National car ownership statistics
There were a total of 284,614,269 registered vehicles in the United States in 2023, according to the Federal Highway Administration. That's an 8% increase from 2015, when there were 263,610,219 registered vehicles on the road in the U.S.
It might surprise you to learn that trucks, and not automobiles, were the most popular type of vehicle. Even though car insurance quotes tend to be higher for trucks, they make up well over half the vehicles in the country.
| Automobiles Registered | Buses Registered | Trucks Registered | Motorcycles Registered | Total Vehicles Registered |
|---|---|---|---|---|
| 96,901,563 | 967,525 | 177,228,271 | 9,516,910 | 284,614,269 |
Most households (91.5%) had at least one vehicle available in 2024. That's 0.6% more than in 2015. Notably, the percentage of households that have one or two vehicles fell slightly from 2015 to 2023 while the percentage of vehicles with three or more vehicles marginally increased.
| Number of Vehicles | Percentage of households (2024) | Percentage of Households (2015) |
|---|---|---|
| No vehicles available | 8.5% | 9.1% |
| 1 vehicle available | 33.2% | 33.7% |
| 2 vehicles available | 36.3% | 37.4% |
| 3 or more vehicles available | 14.4% | 13.8% |
| Any vehicle | 7.6% | 6.0% |
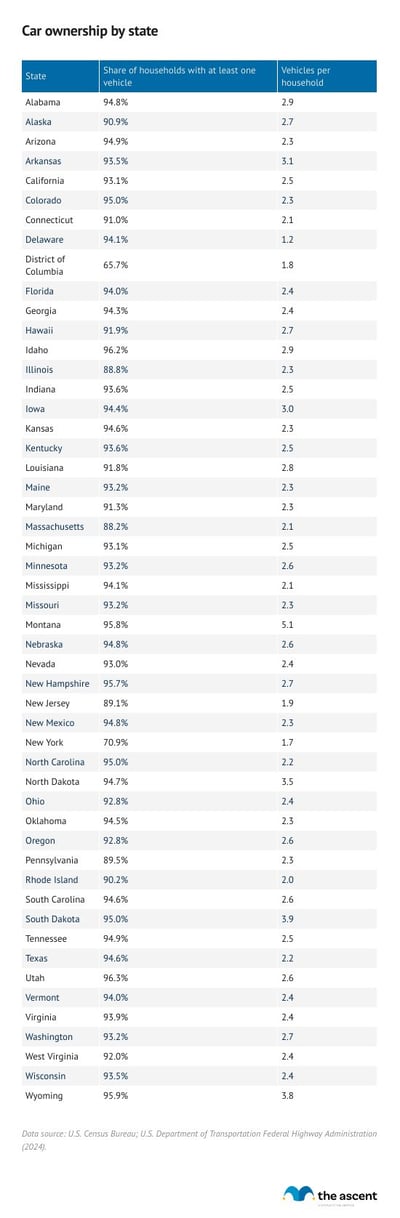
Car ownership rates by state
Car ownership rates vary significantly by area. In Idaho, 96% of households have access to at least one vehicle, compared to just 64% in Washington, D.C. and 71% in New York.
There's also a huge difference in the average number of vehicles per household. Delaware has an average of 1.1 vehicles per household, while in Montana, there's a whopping 5.2 vehicles per household. Ideally those multi-car households are bundling coverages, so they can get discounts on car insurance.
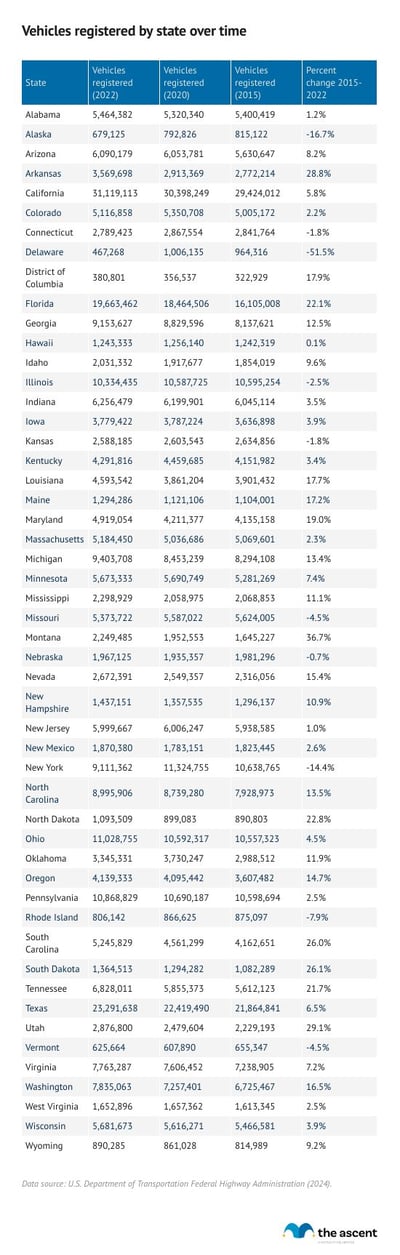
Vehicle numbers per state generally coincide with population numbers. California, Texas, Florida, Ohio, and Pennsylvania have the most registered vehicles and are among the most populous states. From 2015 to 2023, the number of registered vehicles in 38 states and Washington, D.C. increased. Vehicle registrations decreased in 12 states over that period.
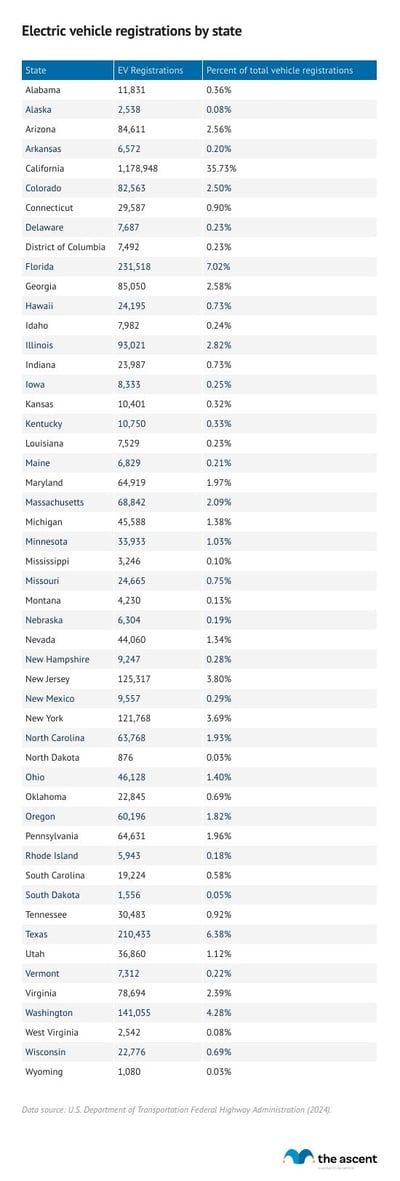
Electric vehicle ownership rates by state
There were 3,555,445 registered electric vehicles in the United States as of September 2024, which is 1.25% of all registered vehicles.
Californians own 35% of the EVs registered in the U.S., some 1.25 million. In no other state is there more than 260,000 EVs registered.
On the other end of the spectrum, North Dakota recorded the lowest total, with just 959 electric vehicles.
With more EVs comes more demand for charging, and California has by far the highest number of EV chargers out of any state. North Dakota has the second-fewest, only ahead of Alaska.
Car ownership rates by city
Murrieta, California is the city with the highest car ownership rate in the United States, as 99.3% of its households own vehicles. Here's the full top 10:
| City | Percentage of Households That Own Vehicles |
|---|---|
| Murrieta, California | 99.3% |
| League City, Texas | 99.0% |
| Surprise, Arizona | 98.7% |
| West Jordan, Utah | 98.7% |
| Cary, North Carolina | 98.6% |
| Pearland, Texas | 98.6% |
| Highlands Ranch, Colorado | 98.5% |
| Centennial, Colorado | 98.3% |
| Gilbert, Arizona | 98.3% |
| Elk Grove, California | 98.2% |
New York City has the lowest car ownership rate by far at 45.6%. Cities with low car ownership tend to have more public transportation options and high population densities. This makes a car more of a luxury than a necessity, especially considering the extra costs involved, such as car insurance and parking.
| City | Percentage of Households That Own Vehicles |
|---|---|
| New York, New York | 45.6% |
| Newark, New Jersey | 59.7% |
| Washington, D.C. | 62.7% |
| Jersey City, New Jersey | 62.9% |
| Cambridge, Massachusetts | 63.2% |
| Boston, Massachusetts | 66.2% |
| Paterson, New Jersey | 67.0% |
| Hartford, Connecticut | 67.4% |
| San Francisco, California | 70.1% |
| Philadelphia, Pennsylvania | 70.5% |
In case you're wondering why Washington, D.C.'s car ownership rate is different here than it was earlier, it's because this data is from TitleMax. The numbers earlier were from the Federal Highway Administration. It's normal to have some variations between data sources.
Car ownership in 2025 and beyond
Although car ownership rates and registered vehicle numbers rose from 2020 to 2023, they did so at a considerably slower rate than from 2018 to 2020. Only 1.2 million new vehicles were registered in 2023, compared to 6.3 million in 2021 and 2.9 million in 2019.
That's a reflection of car prices rising quickly in 2021 and 2022 and inflation continuing to squeeze the wallets of Americans throughout 2023. The price of new vehicles grew faster than red-hot inflation for much of 2021 and 2022.
The recent slowdown in automobile purchases comes after a tough 2020 for the industry. From 2015 to 2019, dealers had five straight years with at least 17 million sales of new light-vehicles, according to the National Automobile Dealers Association. That trend was halted in 2020, as the COVID-19 pandemic and a semiconductor shortage slowed down vehicle production. New light-vehicle sales were just 14.43 million in 2020 and 14.97 million in 2021.
On a positive note, the electric vehicle market has been booming. EV registrations rose by 40% from 2021 to 2022 and another 21% the following year. While the industry is still heavily reliant on the state of California, it's clear that more consumers are making the shift to electric vehicles. State and federal incentives for EV purchases, like tax credits, and more competition among auto manufacturers have made electric vehicles an option for more households as well.
-
Methodology
The average number of vehicles per household was calculated by dividing each state's number of registered vehicles by its number of households.
-
Sources
- TitleMax (2022). "U.S. Cities With the Highest and Lowest Vehicle Ownership."
- U.S. Census Bureau (2024). "2023 American Community Survey."
- U.S. Department of Energy (2025). "Change in U.S. Light-Duty Vehicle Registration Counts."
- U.S. Department of Energy (2025). "Electric Vehicle Registrations by State."
- U.S. Department of Transportation Federal Highway Administration (2017). "Highway Statistics 2015."
- U.S. Department of Transportation Federal Highway Administration (2022). "Highway Statistics 2020."
- U.S. Department of Transportation Federal Highway Administration (2024). "Highway Statistics 2022."
- U.S. Department of Transportation Federal Highway Administration (2025). "Highway Statistics 2023."
Our Research Expert
Jack Caporal is the Research Director for The Motley Fool and Motley Fool Money and has worked full-time for the company since 2021. Jack leads efforts to identify and analyze trends shaping investing and personal financial decisions across the United States. His research has appeared in thousands of media outlets including Harvard Business Review, The New York Times, Bloomberg, and CNBC, and has been cited in congressional testimony. He previously covered business and economic trends as a reporter and policy analyst in Washington, D.C. He serves as Chair of the Trade Policy Committee at the World Trade Center in Denver, Colorado. He holds a B.A. degree in International Relations with a concentration in International Economics from Michigan State University.
Motley Fool Stock Disclosures
Citigroup is an advertising partner of Motley Fool Money. Jack Caporal has no position in any of the stocks mentioned. The Motley Fool has positions in and recommends Tesla. The Motley Fool has a disclosure policy.