Published April 22, 2024
A flowchart is a visual tool that graphically depicts a process or a workflow. Here, we provide a step-by-step guide on how to create a flowchart using the built-in drawing tool in Google Docs.
Flowcharts, which are schematics that use symbols and shapes instead of actual pictures to depict a process, workflow, or algorithm, have been around for decades. Engineers Frank and Lillian Gilbreth are said to be the first to use the flowchart to document process flow in 1921.
When used as project management visual aids, flowcharts accomplish several things:
- Clarity: Team members can better visualize the project management steps to take throughout the project’s life cycle.
- Coordination: Flowcharting enhances team collaboration and eliminates unnecessary work because everyone knows the sequence of events.
- Communication: Flowcharts show how complex processes are done using easy-to-understand diagrams.
- Analysis: Because the process flow is mapped out from beginning to end, it’s easier to pinpoint where bottlenecks are likely to occur, enabling project managers to refine the project management plan accordingly.
You may create flowcharts using a dedicated flowchart tool or diagram software, such as Microsoft Visio or Lucidchart, but Google Docs is also an option you should check out.
The different parts of a flowchart, symbols, and shapes
Before we launch into a discussion of how to create a flowchart in Google Docs, let’s first touch on the most commonly used parts of a flowchart.
Start/end
Every flowchart has a start, but certain flowcharts don’t have an end. Flowchart starts and ends are represented by a rounded rectangle or the terminal symbol.
Process
Process depicts what’s being done. It’s the part of a flowchart that involves action and is rectangular in shape. Examples include “turn on the monitor,” “feed the dog,” “play Netflix,” or “send to the approving manager.”
Decision
This is where decisions go, which are typically yes/no or true/false questions. Based on the answers to those questions, the process or algorithm will flow in two separate directions. The decision symbol is represented by a rhombus or a diamond.
Arrows
Arrows or flowlines indicate the direction of the process or the flow of control.
Generally, flowlines and rectangular blocks are all you need to create a simple flowchart. But if you want your chart to include more detail, the screenshot below shows different flowcharting symbols, from basic to advanced.
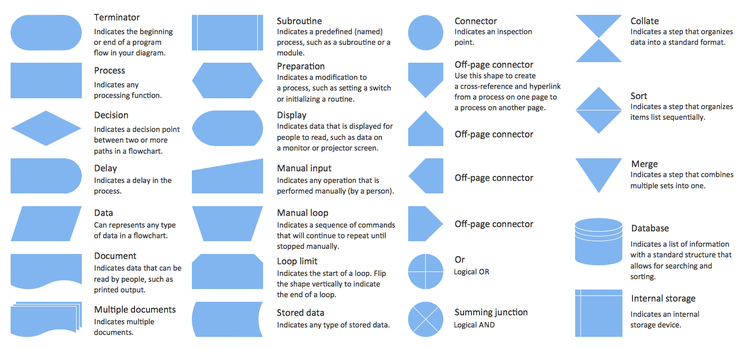
The different flowchart symbols and what they’re used for. Image source: Author
Using Google Docs to create a flowchart
Google Docs is a versatile project collaboration application. With its built-in drawing tool, not only can you write and format text documents but you can also design a custom flowchart -- and even a Google Docs project timeline.
Now that we’re ready to make a flowchart, let’s dive in.
1. Open a Google document
Do that by entering docs.google.com into your address bar. Sign in and open a blank Google document.
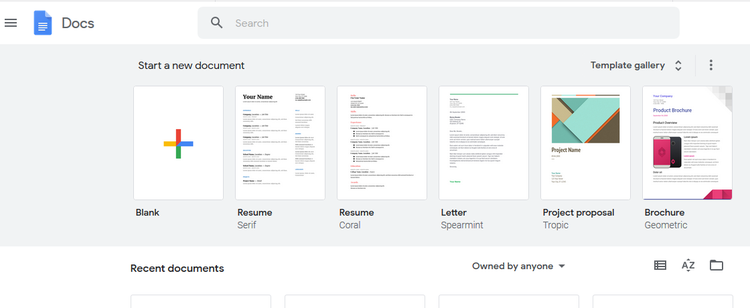
Select the “Blank” document option to open a new Google document. Image source: Author
Alternatively, navigate to drive.google.com, sign in, click on the “+ New" button on the top left-hand side, and select “Google Docs” from the menu options. An untitled document will open in a new tab. Name the document.
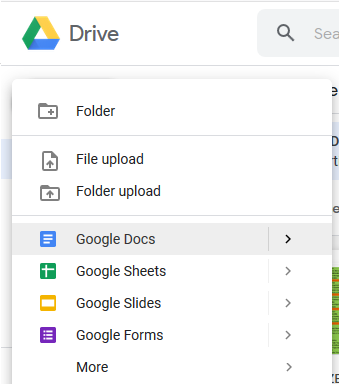
To start creating a flowchart, go to Google Drive and open a new Google Docs document. Image source: Author
If your flowchart is horizontal, go to the File tab on the menu bar, select “Page setup,” then choose “Landscape” to change the page’s orientation from portrait to landscape.
2. Open Google’s drawing tool
We will be using Google Docs’ diagramming tool to create a flowchart. To do that, click on "Insert" from the menu bar on top, hover your mouse over the “Drawing” option, and click on “+ New.”
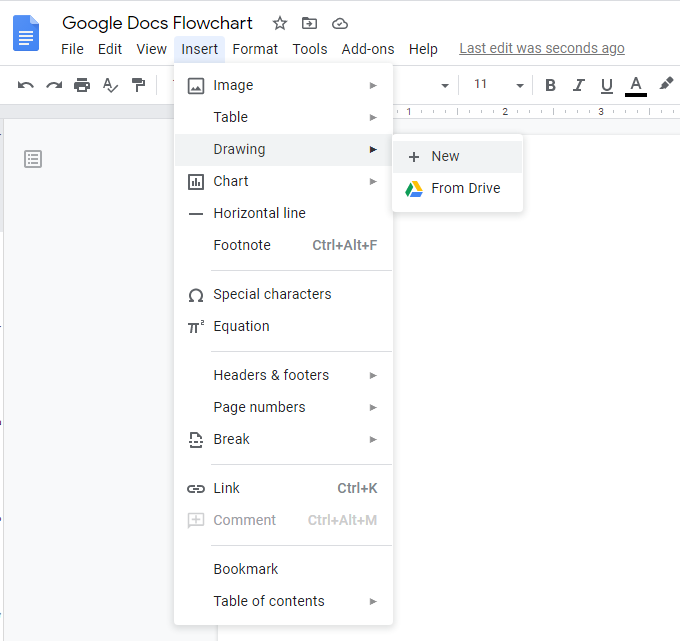
To open the built-in Google draw tool, click on the Insert menu, hover your mouse over the “Drawing” option, and then click on “+ New.” Image source: Author
A blank drawing canvas will appear on top of your Google document.
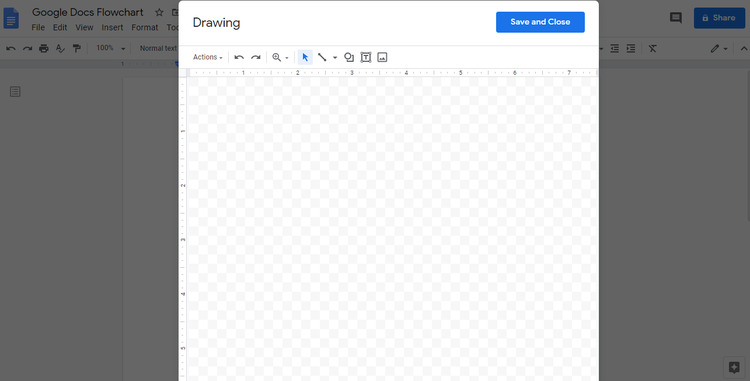
A blank drawing canvas will pop up over your Google document when you click on “+ New” from the Insert >> Drawing menu. Image source: Author
To see the different flowcharting objects, on the drawing toolbar, click on the Shapes tool (icon with the circle and square to the left of the boxed “T”), then select “Shapes” from the list of options. You’ll find the different flowcharting shapes at the bottom half of the menu.
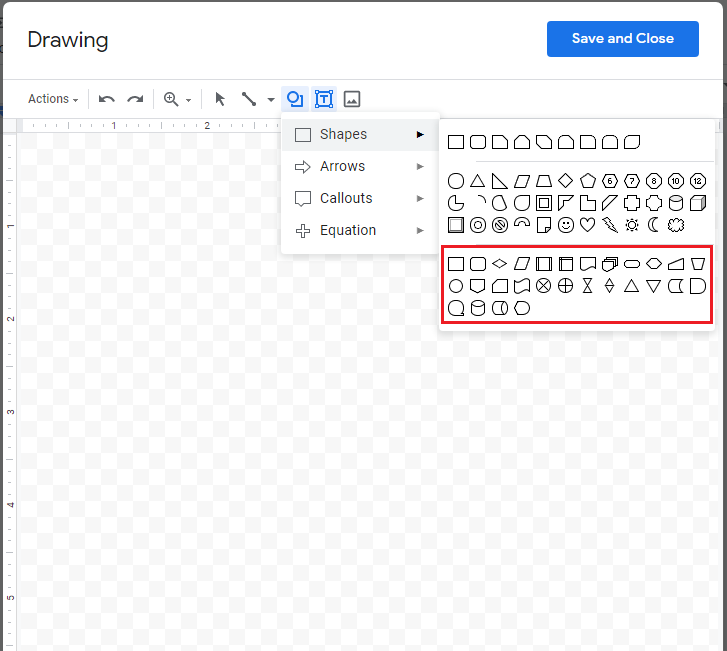
The Google flowchart tools can be found at the bottom half of the Shapes menu. Image source: Author
If you’re not familiar with the different shapes and what they represent, mouse over an object, and hover text will appear indicating its function.
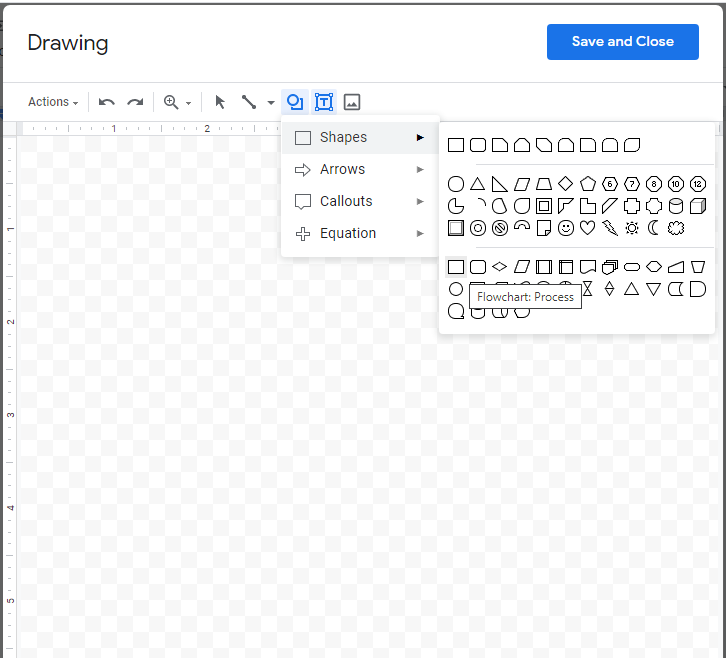
If you hover your mouse over a flowchart symbol, you’ll see what it’s used for. In this example, the rectangle is for a process or action. Image source: Author
3. Add shapes
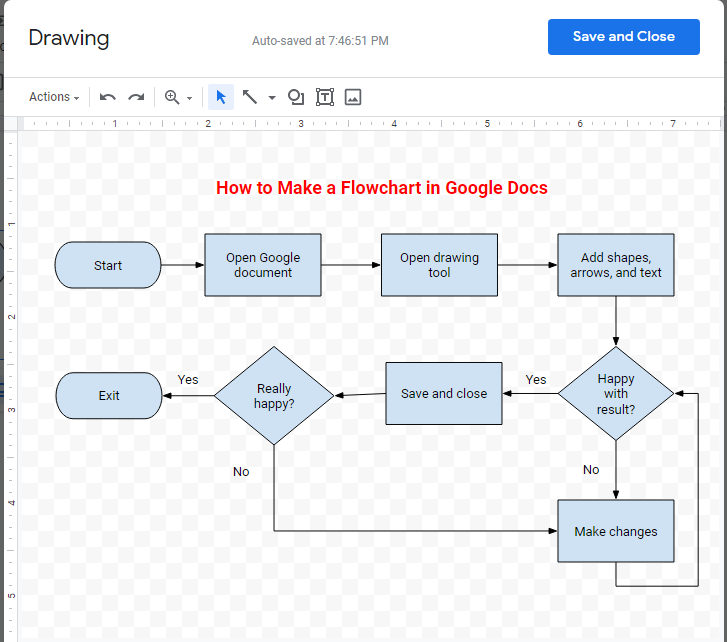
As an example, we will be creating a flowchart out of this guide. We’ll name our flowchart, “How to Make a Flowchart in Google Docs.”
To start the process, select the flowchart terminator -- or the rounded rectangle -- from the Shapes menu.
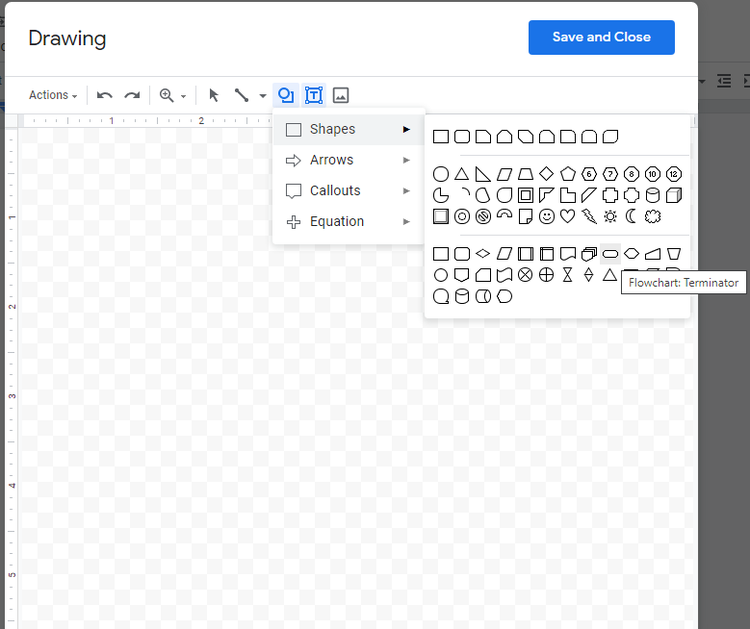
When you mouse over the rounded rectangle, you’ll see the text “Flowchart: Terminator” to signify that it’s the shape you will be using to start your flowchart. Image source: Author
Add each shape or object you need individually. You may copy-paste the shapes, so they’re all the same size.
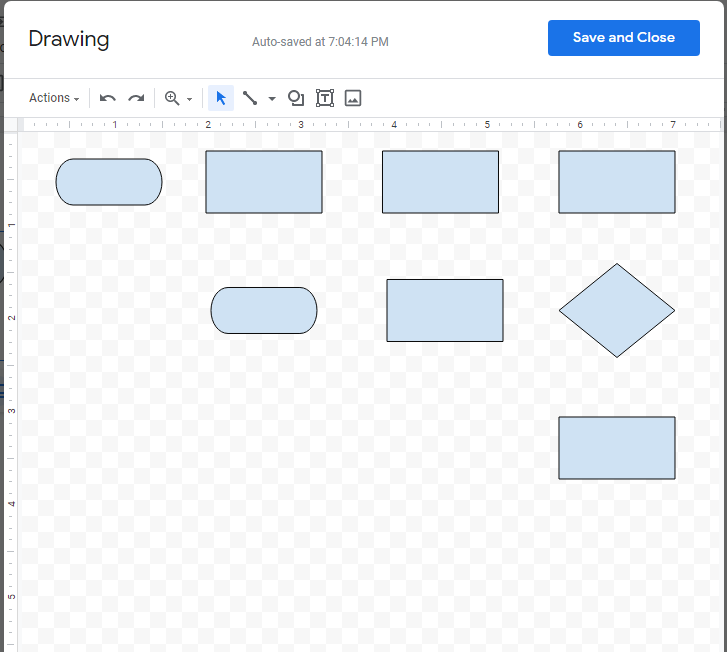
When you’re done adding your shapes, your flowchart will look like this. Image source: Author
4. Add arrows
To draw your arrows or flowlines, click on the Line tool on the toolbar, then select “Arrow” or “Elbow Connector” from the drop-down menu, depending on the type you need.
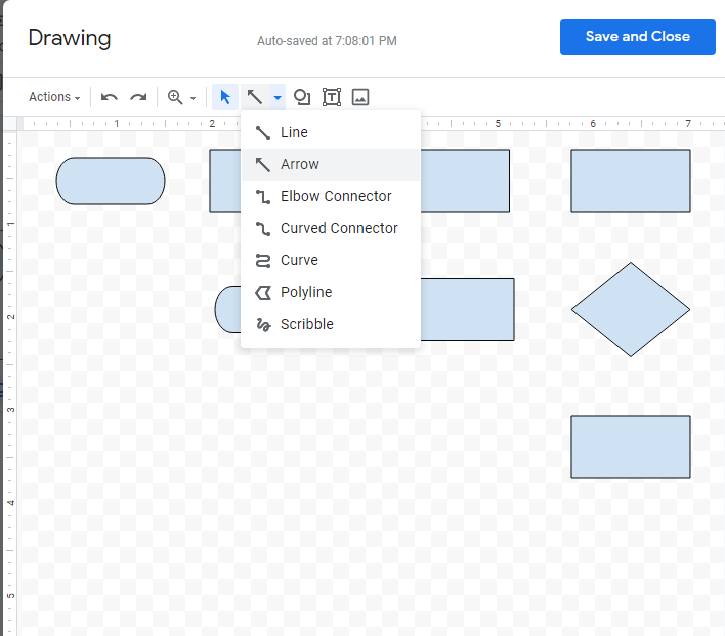
From the Line menu on your toolbar, select “Arrow” to create your flowlines. Image source: Author
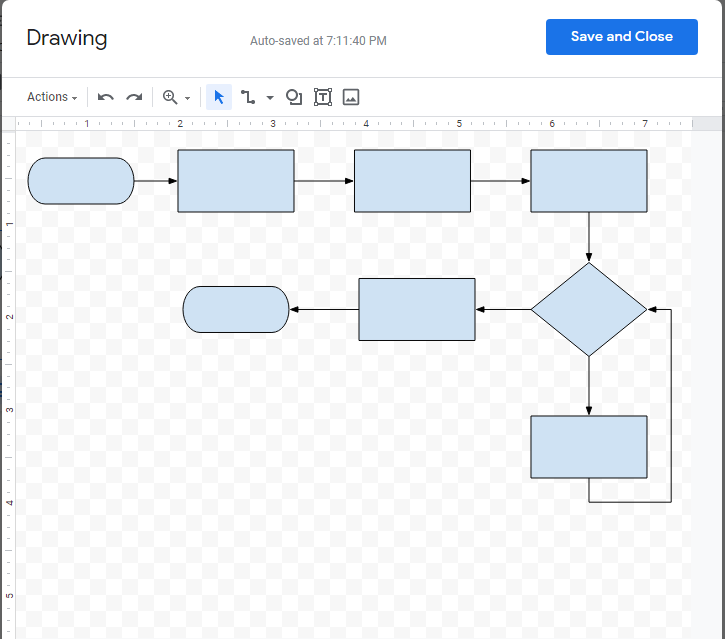
When you’re done adding the arrows, your flowchart will look like this. Image source: Author
5. Add text
Next, add the corresponding text inside the shapes using the Text tool, which is the boxed “T” icon in the drawing panel.
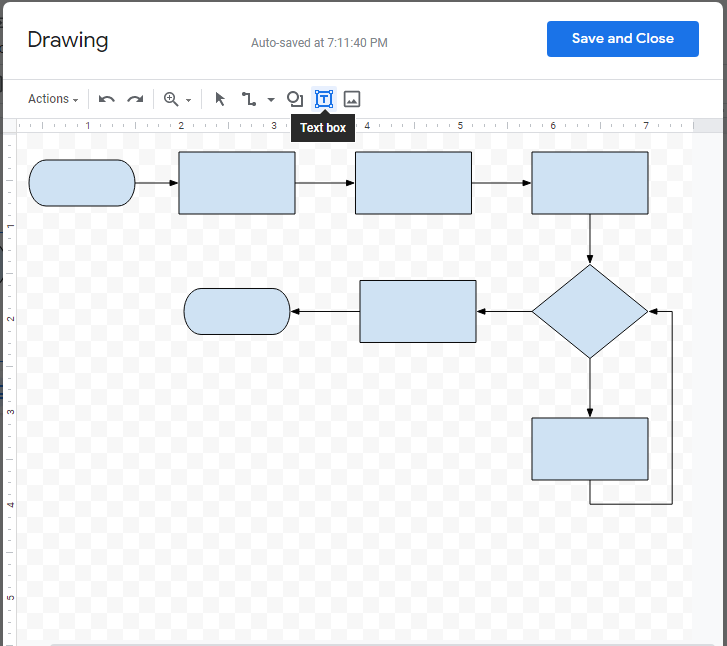
To add text to your flowchart, click on the “Text box” icon on the top toolbar. Image source: Author
To format your text, highlight it, then click on the three dots in the toolbar. You now have the option to change the font type, enlarge or make the text smaller, and align it as you see fit. Copy-paste the text to retain its formatting.
Format your text using the font formatting pane. Image source: Author
6. Save your flowchart
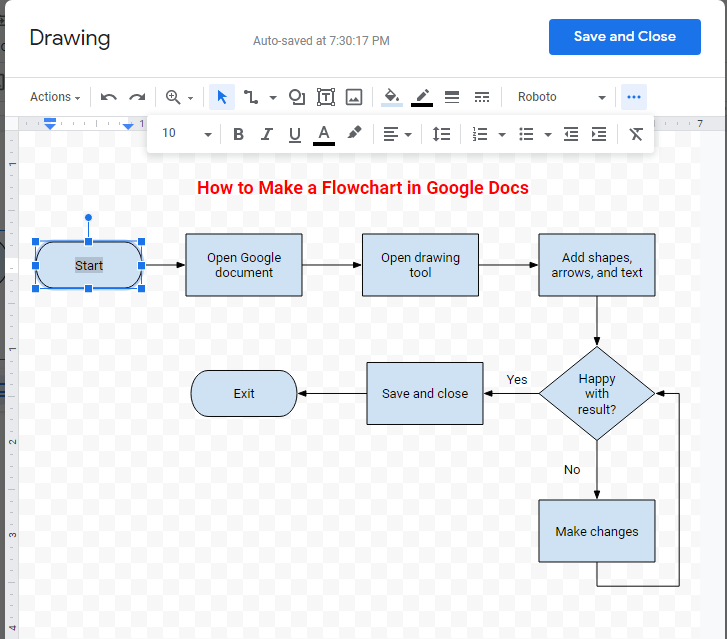
Once you’re done, click on the blue “Save and Close” button. Your flowchart will then be added to your Google document. If you need to edit something, double-click on the flowchart, and you’ll be taken back to the drawing canvas to make the necessary changes.
Even after saving, you can still make changes to your flowchart. Image source: Author
Final word on flowcharts and Google Docs
Flowcharts graphically represent processes and are used as visual tools in a multitude of industries, including engineering, computer programming, and even entertainment. In project management, they can help simplify project planning, regardless of the project methodology you’ve chosen to adopt -- whether it’s project cycle management, the adaptive project framework, or agile.
There are many different ways to create a flowchart, and Google Docs is a great option to consider. The downside is that the process can easily become tedious and time consuming, particularly for complex flowcharts that require up to hundreds of individual objects or elements.
Our Small Business Expert
Maricel Rivera is a business writer and researcher who has worked with the content teams of multiple B2B software companies. Some of her work appear on sites like Yahoo Small Business, Business.com, and Business2Community. When not writing, she’s most likely spending her time making something out of yarn.
Share This Page
We're firm believers in the Golden Rule, which is why editorial opinions are ours alone and have not been previously reviewed, approved, or endorsed by included advertisers. The Ascent, a Motley Fool service, does not cover all offers on the market. The Ascent has a dedicated team of editors and analysts focused on personal finance, and they follow the same set of publishing standards and editorial integrity while maintaining professional separation from the analysts and editors on other Motley Fool brands.
The Motley Fool has a disclosure policy.