Published April 22, 2024
If you understand the four main elements and most common symbols used when making a data flow diagram, you’ll be able to craft one of your own for various processes in your business.
Trying to explain complicated processes to someone who doesn’t have a basic understanding of the concept, or to someone who has only a basic understanding of the concept, can be tricky for project managers.
Using a data flow diagram is the best option if you’re trying to break down a project life cycle in a way that almost anyone can understand. But before you present your data flow diagram, you have to understand how to make one, and why it’s the best option.
The lowest level of a data flow diagram can also be called level 0, or a context diagram. It’s the most basic way to explain, in order, the processes of a software system, but can be used in a variety of other disciplines.
Overview: What is a data flow diagram?
A data flow diagram, or DFD, is a project cycle management tool designed to help explain more intricate processes in a way that someone not already familiar with the process can understand.
It’s used a lot in presentations to investors and stakeholders to portray project planning, but it can even be used to keep employees informed as to what’s going on or how something is done without overwhelming them with a lot of smaller details they may not need.
A data flow diagram example you’ll see most often is based around a hotel room reservation because it’s a simple process with simple external entities, data flows, and data stores to show. We’ll explain the flow diagram symbols and elements later on in this guide.
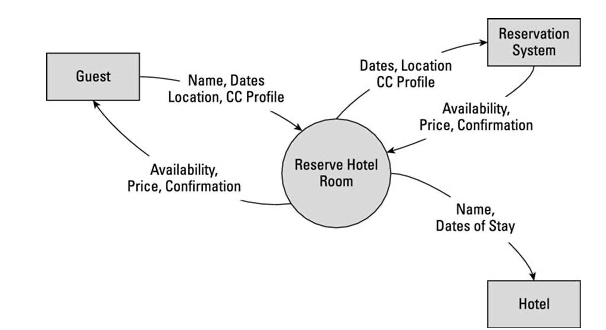
This data flow diagram simply shows the process of a guest booking a hotel room reservation. Image source: Author
What is the benefit of using a DFD?
Why limit yourself to one benefit of using a DFD when there are more? Here are a few key benefits of DFDs:
- Easy to make
- Can be used to explain a wide variety of topics and processes
- Various levels and types of DFDs to choose from depending on your needs
- Provides an easier explanation and understanding of complicated processes
If you’re presenting an idea to stakeholders, investors, or employees, using a DFD will give them enough of an idea of the process to understand it, but not bog them down with entities and elements that don’t necessarily concern them.
Additionally, if you’ve decided that a completed DFD is one of the ways to mark a project milestone, that’s even more reason to make sure you know the ins and outs of the diagram-making process.
The 4 elements of a data flow diagram (DFD) and their symbols
There are four main elements of a DFD that you’ll see in almost every data flow model. However, the simpler ones might not have all four if it’s not absolutely necessary.
There are also fairly standard symbols used to represent each element, but there are no hard and fast rules. As long as you use the same symbols to represent the same elements in every DFD you create, you should be good to go.
Below is a closer look at those four main elements.
1. External entity
An external entity is either where data is taken from or where data is processed. It’s represented by a closed square or rectangle with no additional lines inside it.

We’ll continue to use the example of a hotel room reservation throughout this guide. The external entities from the DFD above are the guest, reservation system, and hotel itself.
2. Process
A process is the main task being performed, so it usually goes in the center of the diagram. If your DFD walk-through requires a more linear or chronological diagram, the process can go on the far left.

The process from the hotel room reservation example above is the act of reserving the hotel room.
3. Data flow
Data flow is represented by lines with directional arrows to show where data moves from and moves to. There can be as many of these you need to accurately represent the flow of data, but be careful not to crowd a single external entity, or else the clarity of the process becomes muddled.
The data flows from the hotel reservation example are:
- Availability, price, and confirmation go from hotel room reservation to the guest.
- Name, dates, and credit card information go from the guest to the hotel room reservation.
- Dates, location, and credit card information go from hotel room reservation to the reservation system.
- Availability, price, and confirmation go from the reservation system to the hotel room reservation.
- Name and dates of stay go from the hotel room reservation to the actual hotel.
4. Data store
The example above doesn’t have any data stores, but they would be represented with a closed square or rectangle with a vertical line on the left side.

If there is a place where data is stored before moving onto another element, or if it is stored there indefinitely, it would be put into a data store. Let’s say a credit card number gets held for incidentals during a hotel stay, this information would be kept in a data store, as well as being part of the data flow if the number is needed in another external entity.
How to create a data flow diagram
Putting together a DFD is one of the many project management steps you’ll want to take to get to project execution. Follow the steps below to get started.
1. Identify the process you’re diagramming
Your business most likely has more than one process, but it’s best to diagram them one at a time. You can choose the process to diagram based on need. If you have a meeting about a certain project coming up, create a DFD and have it ready to go for the meeting.
If you’re training employees on how things work at your company, the DFD you create will be a great training material to familiarize these new employees with some of the processes at your business.
2. Find a template
If you’re already using project management software, it might include templates you can use. If not, there are plenty of templates online that you can use. Here are a few examples:
- Microsoft Excel
- SmartDraw
- Lucidchart
3. Add your process
This will be the first thing that you add and is normally represented by a circle in the center of your diagram. Since DFDs don’t always display a linear process, being in the middle is fine.
However, if you are diagramming a process that can be more easily conveyed through linear diagramming, by all means, place your process on the far left.
4. Add external entities
External entities should be the next elements you add to your diagram because it will be easier to figure out the data flows if the entities are already laid out in the diagram.
The biggest thing to remember with these is to label them so you know exactly what they are, but keep it to only as many words as you need to explain the entity. In the example above, all but one external entity is one word, and the one that is two words is necessary because that is just the name of the entity.
5. Add data stores (if needed)
As mentioned above, not every DFD will need data stores, but if yours does, make sure to follow the same labeling method as for external entities, and differentiate them with a different symbol.
You can use the rectangle with a vertical line as drawn above, or you can choose one of your own as long as you continue to use that symbol to represent data stores.
6. Add data flows
The final step is to add all of your data as it flows from your process to your external entities to your data stores (if used). Make sure the arrows of your lines are pointing in the right direction and you don’t have so many data flows that it looks cluttered.
If that does happen, you might need to get a little more specific with your external entities in order to lessen the amount of data flows you have going to a single, broader, external entity.
The ultimate goal of a DFD
Creating a DFD should be a crucial part of your project management framework. The ultimate goal is being able to explain a complicated concept to someone who doesn’t have an understanding of what it is.
Not to mention that they’re easy to create and can be used for almost any process within your business. Follow the steps above and familiarize yourself with the elements and symbols, and you’ll be surprised at how easy those complicated concepts become.
Our Small Business Expert
Jennifer Post graduated from Rowan University with a degree in Journalism and has almost five years experience writing about all things small business. Her work has appeared on sites such as Business News Daily and Business.com. She specializes in many things, including marketing, software (HR, POS), and business formation. When she's not working, you will almost always find Jennifer whipping up something in the kitchen.
Share This Page
We're firm believers in the Golden Rule, which is why editorial opinions are ours alone and have not been previously reviewed, approved, or endorsed by included advertisers. The Ascent, a Motley Fool service, does not cover all offers on the market. The Ascent has a dedicated team of editors and analysts focused on personal finance, and they follow the same set of publishing standards and editorial integrity while maintaining professional separation from the analysts and editors on other Motley Fool brands.
The Motley Fool has a disclosure policy.