Published April 22, 2024
The schedule performance index (SPI) measures how closely your project follows the schedule. In this guide, we share some examples and what to watch out for when working with SPI.
The project schedule is a critical project tool. It communicates many things: which tasks must be done and when, the resources assigned to perform tasks, due dates, the milestones the team has achieved and is yet to achieve, and so on.
A project that’s behind schedule can cause a series of events detrimental to project success:
- The project goes over budget
- Deliverables fail quality checks
- Stakeholders are unhappy
- Everybody is stressed
This is why project managers, regardless of the project management framework they adopt, use an assortment of techniques and tools - Gantt charts, PERT charts, the prioritization matrix, etc., -- to keep things on schedule.
And then, there’s this indicator called the schedule performance index (SPI), which measures the project’s actual performance against the schedule.
Overview: What is the schedule performance index (SPI)?
The schedule performance index is a subset of earned value management (EVM), a popular but controversial technique for measuring project performance. EVM shows how the work accomplished to date measures against the baselines established during the project planning stage.
Both schedule variance (SV), also an EVM calculation, and SPI measure whether a project is behind, on, or ahead of schedule. SV gauges how much the actual work is deviating from the planned schedule, while SPI is the ratio of the performed work to the scheduled work.
It quantifies scheduling efficiency and shows, in percentage terms, the project’s status vis-a-vis the timeline.
Find more info on the schedule variance calculation, plus examples, in our SV article here.
Schedule performance index (SPI) vs. cost performance index (CPI): What's the difference?
Cost performance index (CPI) is also an earned value metric. While SPI measures scheduling efficiency, CPI measures the project’s cost efficiency. It’s the ratio of the work completed to date to the total amount spent to complete the work.
The CPI formula is:
- Cost Performance Index (CPI) = Earned Value (EV) / Actual Cost (AC)
- CPI = EV / AC
If the CPI calculation is:
- Equal to 1: The project is on budget.
- Less than 1: The project is over budget. The value of the performed work is less than the money spent.
- Greater than 1: The project is under budget. The value of the performed work is greater than the money spent.
To calculate earned value:
- Earned Value (EV) = % of Completed Work x Budget at Completion (BAC)
- EV = % Actual Complete x BAC
Budget at completion is the total project budget.
As for the AC, get all the costs associated with the work performed, including labor, machinery, travel, software licenses, etc.
Cost schedule index (CSI)
Another earned value formula worth mentioning is the cost schedule index. It measures the project’s overall efficiency and indicates how likely a project that’s deviating from baselines is to recover.
It’s calculated as:
- Cost Schedule Index (CSI) = Cost Performance Index (CPI) x Schedule Performance Index (SPI)
- CSI = CPI x SPI
The farther the CSI is from 1.0, the more unlikely a project that is late and/or over budget is to recover.
What is the formula for the schedule performance index?
To illustrate the relationship between earned value and planned value, which are necessary for calculating SPI, take a look at this graph:
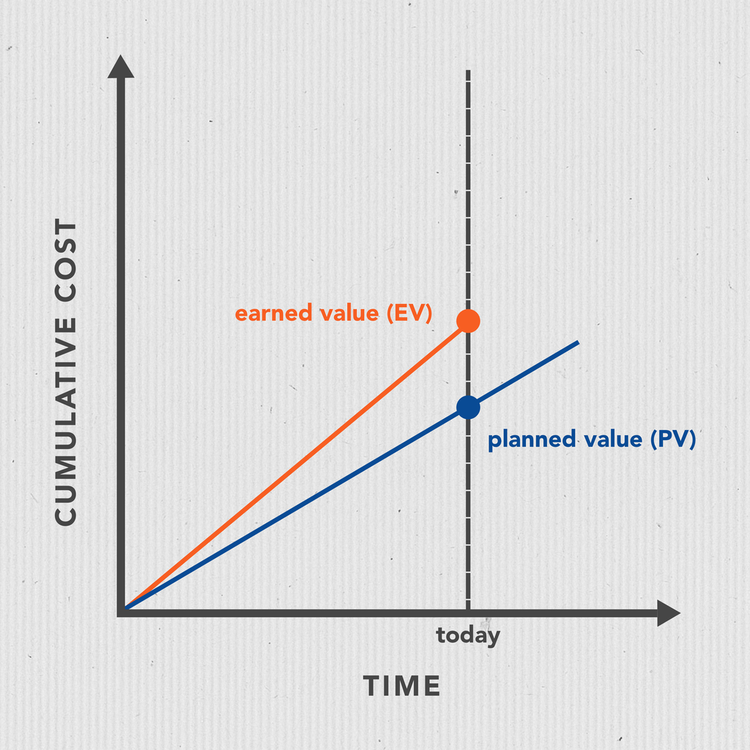
Here, we see that the performed work (earned value) to date is greater than the scheduled work (planned value). Image source: Author
To calculate your project’s SPI performance, the formula is:
- Schedule Performance Index (SPI) = Earned Value (EV) / Planned Value (PV)
- SPI = EV / PV
If the SPI calculation yields a value that is:
- Greater than 1: The project is ahead of schedule.
- Less than 1: The project is behind schedule.
- Equal to 1: The project is on schedule.
We already know how to calculate the earned value. To find the planned value, multiply the percentage of the scheduled work to the project’s budget.
- Planned Value (PV) = Planned % Complete x Budget at Completion (BAC)
- PV = % Planned Complete x BAC
So if your project is scheduled for, say, two weeks and it’s now exactly a week since you started, according to the schedule, your project should already be 50% complete.
Let’s consider some examples.
Example SPI calculation No. 1
Project #1 has a $5,000 budget and is scheduled for 30 days. To date, 50% of the work is complete, which is in line with the project’s schedule.

50% of the work is complete, as scheduled, but the actual cost is $500 more than planned. Image source: Author
Based on the figures on the sheet, the earned value is:
- EV = % Actual Complete x BAC
- EV = 50% x $5,000
- EV = $2,500
The planned value to date is:
- PV = % Planned Complete x BAC
- PV = 50% x $5,000
- PV = $2,500
Substituting EV and PV in the SPI formula, we get:
- SPI = EV / PV
- SPI = $2,500 / $2,500
- SPI = 1.00
Since SPI is equal to 1, the project is on schedule. You’re getting an hour’s worth of work for every hour you put into the project.
Now, if you’re thinking, sure, it’s on schedule, but it’s over budget, you are correct. But SPI isn’t designed to measure cost efficiency. That’s CPI’s job -- hence, the “cost” in cost performance index.
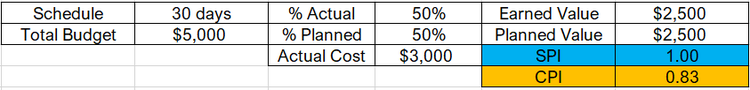
This project is on schedule but over budget, as indicated by the CPI. Image source: Author
To calculate CPI:
- CPI = EV / AC
- CPI = $2,500 / $3,000
- CPI = 0.83
Since CPI is less than 1, the project is over budget. For every $1 you spend on the project, you get $0.83 back.
Example SPI calculation No. 2
Next, we have a 15-day project on a $10,000 budget. Three-fourths of the project is scheduled for completion today, but the project team went above and beyond expectations by completing 80% of the work instead of 75%.

The project is early. Completed work to date is greater than planned. Image source: Author
The project’s earned value is:
- EV = % Actual Complete x BAC
- EV = 80% x $10,000
- EV = $8,000
As for planned value:
- PV = % Planned Completed x BAC
- PV = 75% x $10,000
- PV = $7,500
Now, computing for SPI, we have:
- SPI = EV / PV
- SPI = $8,000 / $7,500
- SPI = 1.06
Since SPI is greater than 1, our project is ahead of schedule. For every hour you put in, you get back 1.06 hours’ worth of work.
But what about the CPI? To get the CPI:
- CPI = EV / AC
- CPI = $8,000 / $8,000
- CPI = 1.00
In terms of cost efficiency, the project is on budget. You get a dollar’s worth of work for every dollar you spend on it.
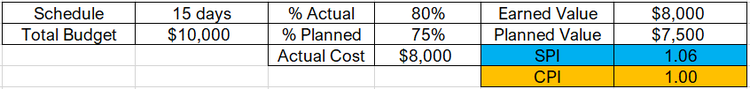
Based on our SPI and CPI calculations, the project is on budget and ahead of schedule. Image source: Author
3 tips to work with the schedule performance index
Although useful to measure project performance, SPI has limitations. It’s important to keep the following considerations in mind when working with SPI.
Tip 1: A good SPI isn’t always good
SPI cannot distinguish critical from noncritical tasks -- meaning, noncritical tasks that are ahead of schedule may obscure critical tasks behind schedule. Therefore, SPI may indicate a project is moving at a good pace when it actually isn’t.
Also, at the end of every project, the SPI is always marked as 1, regardless of the actual completion date. So even if you deliver the project six months after the due date, SPI will say it’s on schedule.
Tip 2: SPI is only as good as the data you keep
SPI relies heavily on the accuracy of the data you feed it. If the data you’re working off of is problematic, e.g., incomplete work breakdown or delayed costs reporting, then SPI won’t be much help. Garbage in, garbage out.
Tip 3: SPI shouldn’t be used on its own
To get an accurate view of the project’s schedule performance, SPI values are best analyzed alongside other project management techniques, particularly the critical path method (CPM). This way, if SPI is indicating one thing and CPM another, dig deeper and uncover the true story.
Keeping your project schedule on track
SPI is just one of several ways to stay in control of the project’s schedule. While not perfect, it’s no doubt a useful tool for ensuring the project follows its designated roadmap.
So your project team can more efficiently collaborate on projects and better track your project’s schedule, consider some of the project management software options The Ascent has reviewed. We rate each one according to ease of use, features, pricing, and quality of support.
Our Small Business Expert
Maricel Rivera is a business writer and researcher who has worked with the content teams of multiple B2B software companies. Some of her work appear on sites like Yahoo Small Business, Business.com, and Business2Community. When not writing, she’s most likely spending her time making something out of yarn.
Share This Page
We're firm believers in the Golden Rule, which is why editorial opinions are ours alone and have not been previously reviewed, approved, or endorsed by included advertisers. The Ascent, a Motley Fool service, does not cover all offers on the market. The Ascent has a dedicated team of editors and analysts focused on personal finance, and they follow the same set of publishing standards and editorial integrity while maintaining professional separation from the analysts and editors on other Motley Fool brands.
The Motley Fool has a disclosure policy.