One of Wall Street's few constants is volatility. Since this decade kicked off, the iconic Dow Jones Industrial Average (^DJI 0.40%), broad-based S&P 500 (^GSPC 1.02%), and growth-fueled Nasdaq Composite (^IXIC 2.02%), have navigated their way through two bear markets (2020 and 2022) and one euphoria-driven bull market (2021).
With the major indexes sticking with their recent "theme" of reversing course every year, 2023 has led to strong returns for the S&P 500 and Nasdaq Composite. The $64,000 question is, "What's in store for Wall Street in the months, quarters, and years that lie ahead?"
To be upfront, there is no economic indicator or predictive tool that's going to accurately call directional short-term movements in the stock market 100% of the time. There are, however, certain metrics that have historically offered strong correlations to movements in equities, as well as the health of the U.S. economy.
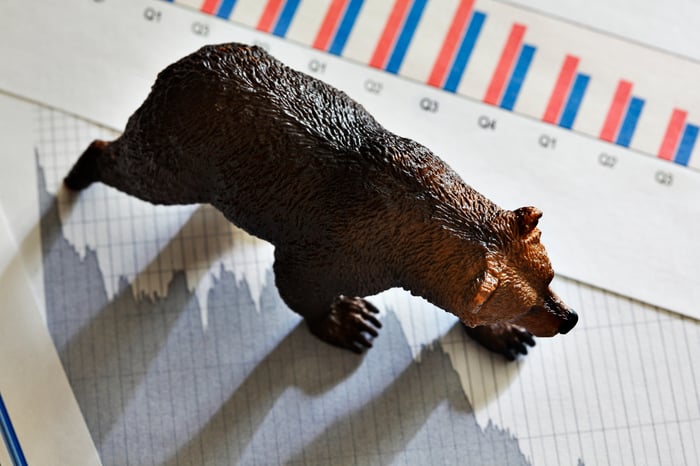
Image source: Getty Images.
Trouble may be brewing for the U.S. economy
For much of the year, I've examined how the Treasury yield curve, U.S. money supply, commercial bank credit, and a host of other factors, have correlated with the strength or weakness in the U.S. economy and, subsequently, directional moves in the stock market. Today, let's take a closer look at an economic data point that has an uncanny ability to predict U.S. recessions: the U.S. unemployment rate.
There's no mystery to this metric. It compares the number of unemployed Americans who are actively looking for work to those currently in the labor force. Generally, a steadily declining or sustainably low unemployment rate of 4% or below, tends to signal a growing/healthy economy.
In August, the U.S. unemployment rate came in at 3.8%, with 6.4 million people unemployed and just over 168 million Americans in the civilian labor force. Sounds rock-solid, right? Not so fast.
The 3.8% unemployment rate for August marked the highest level of U.S. unemployment since early 2022. Although we're only talking about a 40-basis-point increase in the unemployment rate (3.4% to 3.8%) from recent trough to peak, we haven't seen a 40-basis-point aggregate uptick in the U.S. unemployment rate without a recession taking place since November 2010, which was very shortly after the Great Recession came to a close.

US Unemployment Rate data by YCharts. Gray areas denote U.S. recessions.
If you widen the lens, as shown in the chart above, a rising U.S. unemployment rate has been a near-perfect predictor of U.S. recessions dating back 75 years. If companies are slowing their hiring, it tends to be a pretty big clue that a U.S. economic downturn isn't too far off.
Admittedly, a 40-basis-point upswing in the unemployment rate isn't exactly a blaring warning for the U.S. economy. Shifts in the labor force participation rate, such as older workers dropping out of the labor force, have been known to cause very temporary hiccups higher, and lower, in the U.S. unemployment rate.
Nevertheless, the Federal Reserve's most-aggressive rate-hiking cycle in more than 40 years can't be overlooked. The absence of cheap capital to borrow has made companies more hesitant to hire, acquire, and innovate. While it can take time for 525 basis points of cumulative increases in the federal funds rate to work their way into the economy, it's very possible the uptick we're witnessing in the U.S. unemployment rate is indicative of the Fed's actions beginning to hit home.
Historically, stocks have performed poorly in the year following the declaration of a U.S. recession. Approximately two-thirds of the S&P 500's total drawdowns have occurred after a recession is declared. Thus, a rising U.S. unemployment rate may spell trouble for the Dow, S&P 500, and Nasdaq Composite.

Image source: Getty Images.
Recessions can be blessings in disguise for long-term investors
The growing probability of a U.S. recession may not be what you expected to hear given how strongly and decisively the Dow, S&P 500, and Nasdaq, have bounced off of their 2022 bear market lows. But if you're a patient investor who's looking to the horizon, there's also plenty of good news.
On Wall Street, getting from Point A to B isn't going to happen in a straight line. It's going to involve economic downturns, stock market corrections, and probably even bear markets and/or short-lived crashes. These sidesteps may be unpleasant in the short run, but they're, historically, blessings in disguise for long-term investors.
Over the past 73 years, there have been 39 double-digit percentage downturns in the widely followed S&P 500. But did you also know that, with the exception of the 2022 bear market, each and every one of these double-digit dips were eventually cleared away by a bull market rally?
We may not be able to forecast when these downturns and rallies will begin, or how long they'll last, but we do know, based on historic precedent, the Dow, S&P 500, and Nasdaq tend to increase in value over time. In other words, high-quality, innovative, profitable businesses, many of which have sustained catalysts or moats, have a propensity to grow in value over long periods. If the share price of these businesses declines during a recession, it provides the perfect opportunity for patient investors to pounce.
In addition to patience paying off for investors, optimism also tends to win out.
It's official. A new bull market is confirmed.
-- Bespoke (@bespokeinvest) June 8, 2023
The S&P 500 is now up 20% from its 10/12/22 closing low. The prior bear market saw the index fall 25.4% over 282 days.
Read more at https://t.co/H4p1RcpfIn. pic.twitter.com/tnRz1wdonp
In June, wealth management company Bespoke Investment Group released a dataset that compared the average length of S&P 500 bull markets since September 1929 to the average length of bear markets. For reference, Bespoke defined a "bull market" as a 20% (or greater) rally that was preceded by a 20% (or greater) decline. A bear market is the inverse of the above: a 20%+ decline that was preceded by a 20%+ rally. A total of 27 bull markets and 27 bear markets were identified.
Since the beginning of the Great Depression in 1929, the average bear market has lasted a mere 286 calendar days, or roughly 9.5 months. Comparatively, the average bull market has continued for 3.5 times as long (1,011 calendar days).
No matter what the U.S. economy or Wall Street throws at investors, patience and optimism always, eventually, prevail.


