Investing on Wall Street comes with undeniable ups and downs. Although the stock market has been a proven moneymaker when examined over multiple decades, it's completely unpredictable over the short term.
Since this decade began, investors have had their resolve tested by two bear markets (2020 and 2022). With the ageless Dow Jones Industrial Average (^DJI 0.40%), benchmark S&P 500 (^GSPC 1.02%), and growth-fueled Nasdaq Composite (^IXIC 2.02%) all rallying more than 20% from their 2022 bear market lows, investors are left to wonder if the major indexes will continue motoring to new highs, or if the ghosts of the 2022 bear market will reappear.
While there is no such thing as a perfect indicator when it comes to forecasting short-term directional movements for the major indexes, there are plenty of economic datapoints and metrics that strongly correlate to short-term moves in the broader market. At the moment, America's banks appear to be telegraphing where stocks are headed next. The big question: Is anyone paying attention?
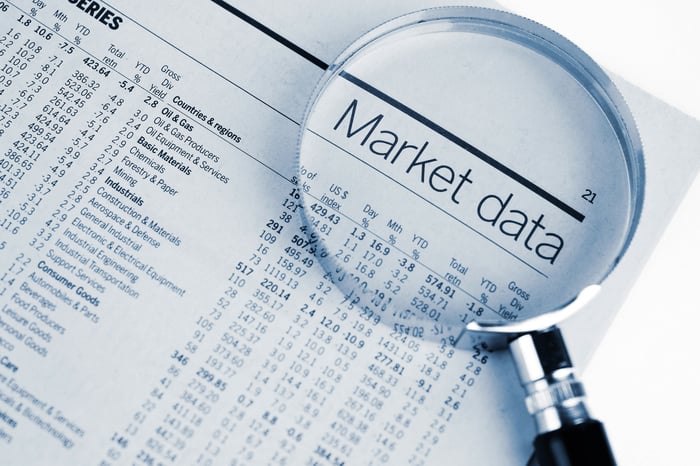
Image source: Getty Images.
Two lending charts paint quite the picture
Although megacap tech stocks and artificial intelligence (AI) have been the talk of Wall Street for pretty much the entirety of 2023, it doesn't change the fact that banks are the structural backbone of the U.S. economy. Bank lending activity, along with delinquency/charge-off rates, can paint quite the picture for investors, and perhaps even clue them into where stocks may head next.
If there's a banking metric above all others that deserves investors' attention, it's commercial bank credit, which is reported on a weekly basis.
Since the start of 1973, aggregate bank loans and leases outstanding have been steadily moving higher. This is to be expected given that the U.S. economy grows in size over time. Banks are not only incentivized to lend money to take advantage of long-term economic growth, but also to cover the costs associated with taking in deposits. The key takeaway here is that bank lending grows over time.

US Commercial Banks Bank Credit data by YCharts.
However, there have been four instances over the past 50 years where commercial bank credit meaningfully dipped. By "meaningfully," I mean a decline in aggregate loans and leases of at least 1.5% from a record high.
It takes a lot for commercial banks to meaningfully pare back their aggregate lending, but it's happening right now. Since mid-February, commercial bank credit has dipped by 1.87%. While some of this decline has coincided with the short-lived regional banking crisis that saw three notable bank failures, it also comes at a time when the Federal Reserve is hiking interest rates at the fastest pace in over four decades. In other words, it would appear that banks are purposely paring back their outstanding loans and leases in anticipation of higher delinquency rates.
Furthermore, the previous three times commercial bank lending dipped by more than 1.5%, the broad-based S&P 500 ultimately lost around 50% of its value. Declining commercial bank credit has previously been an ominous sign for Wall Street.
But it's not the only banking metric that speaks volumes about where stocks may be headed.
Every quarter, the Board of Governors of the Federal Reserve conducts a survey of senior loan officers to gauge the health and activity of the lending environment for U.S. banks. This includes questioning senior loan officers about commercial and industrial (C&I) loans.

US Net Percentage of Banks Reporting Tightening Standards for C&I Loans to Large and Middle-market Firms data by YCharts. Gray areas denote U.S. recessions.
C&I loans are usually short-term collateralized loans that businesses use for working capital, major projects, and acquisitions. Like aggregate bank lending, the amount of C&I loans outstanding has risen fairly steadily over the long run.
Yet during the third quarter, the Senior Loan Officer Opinion Survey on Bank Lending Practices found that just over 50% of domestic banks were tightening their lending standards on C&I loans to midsize and large firms. What this confirms is that banks are genuinely concerned about the near-term outlook for the U.S. economy, and they're likely anticipating an increase in loan losses and delinquencies to come.
To add, anytime the net percentage of domestic banks tightening C&I loans has surpassed 50% over the past 33 years, it's been followed by a U.S. recession. Historically, the major stock indexes struggle in the year after an official recession is declared.
Although no one seems to be paying much attention to this banking data at the moment, a healthy financial sector is practically a requirement if the Dow Jones, S&P 500, and Nasdaq Composite are to move to new highs.

Image source: Getty Images.
Here's a correlation that investors can absolutely bank on
While the two charts above paint a picture of potential downside to come for stocks, there's another correlation that has a way of always delivering for patient investors.
As much as you might dislike stock market corrections and bear markets, they're simply a normal part of the long-term investing cycle. Since the start of 1950, there have been 39 instances where the S&P 500 has declined by at least 10%, based on data from sell-side consultancy company Yardeni Research. For those of you without calculators, we're talking about a double-digit decline occurring, on average, every 1.89 years.
But here's something else you may have overlooked: With the exception of the 2022 bear market, the previous 38 corrections were all, eventually, wiped away by a bull market rally. Even though we're never going to be able to predict with 100% accuracy when the major stock indexes will head lower, we know that all three major indexes are bound to see new all-time highs over the long run.
What's more, history shows a completely bankable correlation between time and positive investment returns in the S&P 500.

Every year, the analysts at Crestmont Research update their dataset that examines the 20-year rolling total returns, including dividends paid, of the S&P 500. Even though the S&P didn't come into existence until 1923, Crestmont was able to find its components in other indexes, which allowed it to back-test its returns data to 1900. This provided Crestmont with 104 rolling 20-year periods (1919-2022) of data.
What this dataset showed is that 104 out of 104 rolling 20-year periods produced a positive total return. Regardless of whether you invested your money during a bear market or put your money to work close to a near-term peak, you would have generated a positive total return as long as you, hypothetically, held a position in the S&P 500 for 20 years.
Even if banks portend trouble in the quarters to come, time is investors' bankable ally.


