It's that time again -- and I'm not talking about earnings season.
In a little over seven months, Americans across the country will head to the polls or mail in their ballots to determine who'll lead the country over the coming four years. Although there are plenty of aspects of politics that have no bearing on Wall Street, fiscal policy changes that originate in Washington, D.C., and are signed into law by the president of the United States, can ultimately impact corporate earnings and the health of the U.S. economy.
With nearly 2,500 delegates in the ongoing primaries, incumbent Joe Biden is the presumptive nominee for president from the Democratic Party. Since Biden took office as the 46th president on Jan. 20, 2021, the ageless Dow Jones Industrial Average (^DJI 0.40%), benchmark S&P 500 (^GSPC 1.02%), and growth-fueled Nasdaq Composite (^IXIC 2.02%), have respectively gained 28%, 36%, and 22%. All three major stock indexes have also achieved fresh all-time highs since the year began.
But could a second term of Joe Biden at the helm cause stocks to plunge? Let's take a closer look at some of the downside catalysts that could lie ahead and let history be the ultimate judge.
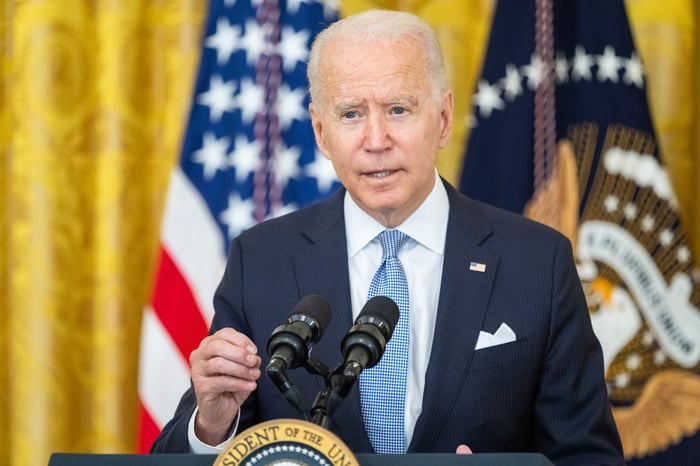
President Biden delivering remarks. Image source: Official White House Photo by Adam Schultz.
Are stocks going to crash if Joe Biden wins in November?
Regardless of who's president, Wall Street is always contending with headwinds. Should Joe Biden get the nod from voters in November, a combination of policy proposals (if signed into law) and macroeconomic factors have the potential to push the Dow Jones Industrial Average, S&P 500, and Nasdaq Composite off of their respective pedestals.
One of the more concerning proposals, from an investment perspective, is Biden's recent call to raise the tax on stock buybacks from the current 1% to 4%. This may not sound like much, but S&P 500 companies are estimated to have repurchased in the neighborhood of $800 billion worth of their common stock in 2023.
For businesses with steady or growing net income, share repurchase programs that lower their outstanding share count can have a positive impact on earnings per share (EPS). In other words, companies enacting buybacks can appear more attractive to fundamentally focused investors. Quadrupling the buyback tax could make share repurchase programs less attractive, thereby slowing EPS growth.
Additionally, President Biden has called for an increase to the corporate alternative minimum tax rate to 21% from the current rate of 15% for businesses with at least $1 billion in profits, and has proposed increasing the peak U.S. corporate income tax rate to 28% from 21%. On paper, taxing corporate profits at a higher rate would be expected to reduce spending on innovation, hiring, and acquisitions.
However, it's not just policy proposals from President Biden that could give Wall Street the jitters. A couple of money-based metrics and recession-predicting tools suggest a second term for Biden could involve meaningful downside for the Dow, S&P 500, and Nasdaq Composite.
WARNING: the Money Supply is officially contracting. 📉
-- Nick Gerli (@nickgerli1) March 8, 2023
This has only happened 4 previous times in last 150 years.
Each time a Depression with double-digit unemployment rates followed. 😬 pic.twitter.com/j3FE532oac
For example, U.S. M2 money supply is declining by more than 2% from its all-time high for only the fifth time when back-tested more than 150 years, and the first time since the Great Depression, as highlighted in the post above by Reventure Consulting CEO Nick Gerli. M2 money supply accounts for everything in M1 (cash and coins in circulation, along with demand deposits in a checking account) and adds in savings accounts, money market accounts, and certificates of deposit (CDs) below $100,000.
The previous four times M2 money supply notably declined occurred in 1878, 1893, 1921, and 1931-1933. All four of these instances are associated with deflationary depressions and high periods of unemployment. While fiscal and monetary tools make it highly unlikely that we'd see a depression materialize today, a sizable decline in M2 money supply does suggest consumers and businesses will make fewer discretionary purchases.
Other predictive tools, such as the Conference Board's Leading Economic Index, and the Federal Reserve Bank of New York's recession probability measure, suggest economic weakness is in the cards.
On paper, a stock market plunge can't be ruled out, regardless of who's in the Oval Office come Jan. 20, 2025. But there's another side to history that should have patient investors excited about the future.

Image source: Getty Images.
Here's what history says happens to stocks when Democrats win the presidency
Historically speaking, the stock market has averaged a positive annualized return with both Democrats and Republicans as president. But since 1945, Democrats in the Oval Office have outperformed Republicans.
According to an analysis from independent financial intelligence company CFRA Research in 2020 (i.e., prior to Biden taking office), Democrat presidents have overseen an 11.2% annualized return in the S&P 500, compared to 6.9% for their Republican counterparts. For instance, Bill Clinton and Barack Obama oversaw respective annualized gains of 15.2% and 13.8% during their eight-year terms.
While there have been a few Republican presidents that have been in office during a rough period for Wall Street -- e.g., the S&P 500 shed 5.6% on an annualized basis while George W. Bush was in office -- Republican Calvin Coolidge oversaw the best stock market performance of any president. In the roughly 5-1/2 years Coolidge was president during the Roaring Twenties, the market delivered a blistering annualized return of 26.1%!
The point being that, over long periods, it doesn't matter which party finds itself in the Oval Office. Although budget proposals from presidential candidates can occasionally stir the pot and upset Wall Street, these events tend to be very short-lived.
Widening the lens beyond four- and eight-year presidential terms yields even more encouraging results for patient investors.
It's official. A new bull market is confirmed.
-- Bespoke (@bespokeinvest) June 8, 2023
The S&P 500 is now up 20% from its 10/12/22 closing low. The prior bear market saw the index fall 25.4% over 282 days.
Read more at https://t.co/H4p1RcpfIn. pic.twitter.com/tnRz1wdonp
Last June, analysts at market insights firm Bespoke Investment Group published a data set that examined the length of bear and bull markets in the S&P 500 dating back to the start of the Great Depression in September 1929. What they found was a milewide disparity between optimism and pessimism on Wall Street.
Over the past 94 years, the 27 bear markets the S&P 500 has worked its way through cleared in an average of 286 calendar days, or about 9.5 months. By comparison, the typical bull market has lasted 1,011 calendar days, or 3.5 times as long.
A separate study conducted by Crestmont Research looked back even further. Since the components of the S&P could be found in other major stock indexes prior to the creation of the S&P in 1923, Crestmont was able to back-test its return data to 1900.
What the researchers at Crestmont did was analyze the rolling 20-year total returns (I.e., including dividends paid) of the S&P 500 since 1900. This yielded 105 unique periods of rolling 20-year total returns (1919-2023).
Here's the kicker: All 105 rolling 20-year periods produced a positive total return. Regardless of which party controls the White House, hypothetically holding an S&P 500 tracking index for 20 years has been a foolproof investment strategy for more than a century.
To add, these weren't paltry gains, either. Whereas you can count on one hand how many rolling 20-year timelines produced annualized total returns of between 3.1% and 5%, more than 50 of these 105 rolling 20-year time frames generated annualized total returns of between 9% and 17.1%.
If Joe Biden wins a second term as president, history suggests long-term investors are going to be well-positioned to grow their wealth on Wall Street.


