
Investors love stocks that consistently beat the Street without getting ahead of their fundamentals and risking a meltdown. The best stocks offer sustainable market-beating gains, with robust and improving financial metrics that support strong price growth. Does Cypress Semiconductor (CY) fit the bill? Let's take a look at what its recent results tell us about its potential for future gains.
What we're looking for
The graphs you're about to see tell Cypress' story, and we'll be grading the quality of that story in several ways:
- Growth: Are profits, margins, and free cash flow all increasing?
- Valuation: Is share price growing in line with earnings per share?
- Opportunities: Is return on equity increasing while debt to equity declines?
- Dividends: Are dividends consistently growing in a sustainable way?
What the numbers tell you
Now, let's take a look at Cypress' key statistics:
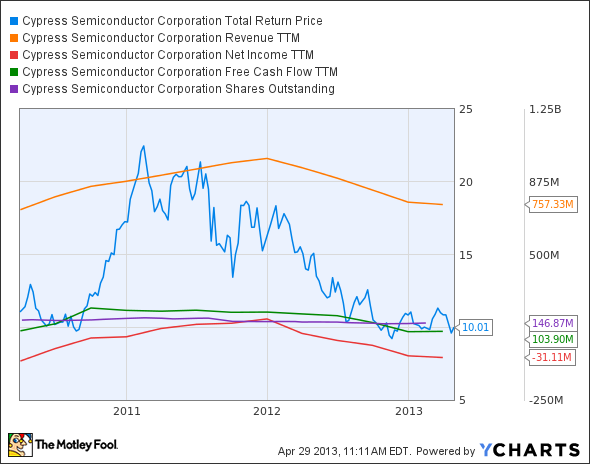
CY Total Return Price data by YCharts.
|
Criteria |
3-Year* Change |
Grade |
|---|---|---|
|
Revenue growth > 30% |
3.6% |
Fail |
|
Improving profit margin |
(363.9%) |
Fail |
|
Free cash flow growth > Net income growth |
(2.1%) vs. 37% |
Fail |
|
Improving EPS |
31.9% |
Pass |
|
Stock growth (+ 15%) < EPS growth |
(9.4%) vs. 31.9% |
Pass |
Source: YCharts. *Period begins at end of Q1 2010.
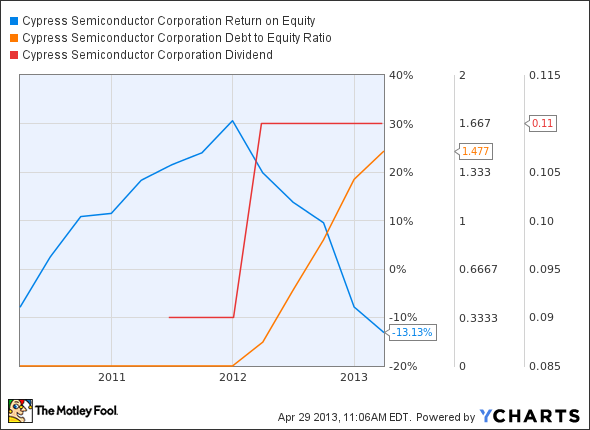
CY Return on Equity data by YCharts.
|
Criteria |
3-Year* Change |
Grade |
|---|---|---|
|
Improving return on equity |
(66.2%) |
Fail |
|
Declining debt to equity |
802% |
Fail |
|
Dividend growth > 25% |
Initiated in 2011 |
Pass |
|
Free cash flow payout ratio < 50% |
47.6% |
Pass |
Source: YCharts. *Period begins at end of Q1 2010.
How we got here and where we're going
Cypress doesn't start out very strong, but a decent showing on dividends pulls the company up to four out of nine passing grades. Investors aren't buying it yet, as the stock has been essentially flat for three years. What will it take to tack on some more passing grades and push this stock back onto the right track?
It's been almost a year since my fellow Fool Evan Niu wrote about Cypress' 52-week low, and little has changed since then. The company continues to head steadily lower, in contrast to fellow touchscreen controller manufacturer Synaptics (SYNA -7.58%), which has taken off since the fall of 2012. Atmel (NASDAQ: ATML), another microcontroller manufacturer, is in similar straits, and has traced Cypress' 52-week decline very closely. Placement is everything, and Cypress hasn't gotten its chips placed in any of the hot mobile devices of the past year. Its biggest "get" was Microsoft's (MSFT -2.17%) Surface, a device that's been greeted with a shrug by the gadget-buying market. The company's latest earnings couldn't even throw investors a bone, as Cypress undermined a quarter of outperformance with guidance indicating further weakness ahead.
Microsoft's weakness, in both tablet and PC markets, seems to be pulling a host of companies down. Cypress isn't alone, but that's small comfort to investors -- especially if they own shares of some of the other key Surface suppliers:

CY Total Return Price data by YCharts.
Some have posted gains, to be sure, but none of these chip makers have bested the indexes over the past year. Despite putting together a similarly moribund performance, Marvell Technology managed a much stronger performance on these same tests late last year. There seems to be little relief for the chip making sector these days, regardless of whether a company has diverse opportunities or -- as in Cypress' case -- finds itself primarily lashed to stagnant product lines.
Putting the pieces together
Today, Cypress has some of the qualities that make up a great stock, but no stock is truly perfect. Digging deeper can help you uncover the answers you need to make a great buy -- or to stay away from a stock that's going nowhere.


