Amazon has been befuddling value investors for years, continuing to grow its market cap without building profits along the way. Some of The Motley Fool's most visible figures have been in the bullish camp, including co-founder David Gardner, who recently made this his first 100-bagger stock pick, and so far the market has agreed with that thesis.
Those buying into Amazon's value often point to continued investment in growth and returns on the cash it invests as the reason the stock is so valuable and why the stock is still a great value. Fellow Fool Morgan Housel recently said that what Jeff Bezos understands that for Amazon to win "the goal should be to become as big as possible as fast as possible." Presumably, small margins on a huge sales base will somehow justify a $170 billion market cap. What most of these bullish arguments rarely do is determine just how much cash Amazon is investing in its business, exactly what the returns are on that cash, and how that compares to competitors like Target (TGT -2.60%) and Wal-Mart (WMT -1.12%).
Putting a value on Amazon
One challenge for those looking at valuation is that it's nearly impossible to value Amazon with any traditional valuation method. The company doesn't make a profit so a P/E ratio is meaningless, it doesn't spit off dividends to shareholders so a dividend model is worthless, and even book value comes nowhere near showing what the company is worth. But Amazon is growing like a weed and continues to grow cash flow, something even Jeff Bezos himself wants us to value Amazon based off of.
The cash flow argument is that Amazon plows every extra penny it has into fixed assets for growth and generates phenomenal returns from that investment, but the returns are lost within the traditional income statement and balance sheet.
So, I decided to answer the question so many Amazon bulls point to but rarely backup with numbers. Below, I'll look at just how much cash Amazon puts into its business, what return it generates on cash, and when it may be able to pay back investors for buying its stock. The result was surprising and enlightening. Whether it makes a bull or a bear change their position may be another story. One takeaway I learned is that Amazon's value today may lie in it reaching $1 trillion in sales sometime in the future.
Amazon's return on invested cash
If Amazon is dumping all of its cash into growing its business it will show up in two places. The cash outflow is reported on the cash flow statement in line items called "Purchases of fixed assets, including internal-use software and web development" and acquisitions. This is a measure of invested capital because Amazon should generate increasing cash flow from investing this this money.
To determine the cash inflow from invested capital I've taken operating cash, which pulls out depreciation on warehouses, amortization, and stock compensation from net income. I've also pulled out the cash generated from accounts payable and receivable changes because this is a one-time benefit so it's not sustainable long-term, especially as Amazon expands its business model. That's not to say it's unimportant, but I'm looking for long-term cash generators, not a one-time benefit that may or may not exist in the future.
I think these measures are more indicative of cash invested and return on cash than tradition ROIC calculations because Amazon has had negative equity in the past, doesn't generate high free cash flow, and has never generated a sustained net income. Even in calculating ROIC the traditional financial statements make Amazon difficult to analyze, which is why I calculated ROIC the way I did.
To calculate return on invested capital, I've assumed that each year's investments generate cash for 10 years with equal cash flow in each year. So, the $657 million invested in 1999 with a 10% ROIC would generate $107 million in cash flow every year for 10 years, similar to how a bank views a mortgage. These cash flows then stack on each other each year to create cash flow growth.
Of course, not every project will have the same cash return or same duration, but over the long-term we should be able to see a trend emerge in Amazon's cash flows. As it turns out, when you assume a 30% annual cash return on invested capital it matches Amazon's actual cash flow quite closely.

Source: Amazon annual earnings reports.
From here we can begin to determine how Amazon may begin living up to its $170 billion market cap, if we assume cash generation is the company's goal as it states.
Can Amazon grow to $1 trillion?
Here's where the real debate about Amazon's market value begins. I've shown that Amazon has generated tremendous returns on capital it's invested but the fact is that Amazon has a relatively small $10.5 billion in invested capital as of 2012. So, even if it makes a 30% return on that capital it will only make $3.15 billion in cash flow, or 1.85% of its market cap. The company will need to invest many more years of cash flow into high ROI projects to live up to its $170 billion market cap.
One way to look at it is by asking when Amazon could generate enough cash to trade at a price/operating cash flow of around 10, a valuation level consistent with competitors. If Amazon continues to generate 30% on each dollar it invests that will happen sometime during 2018, when I've projected sustainable operating cash flow of $20.6 billion. To generate that level of cash flow the company would have to generate about $412.1 billion in sales, slightly less than Wal-Mart.
Another way I've looked at value from cash generation is to ask when Amazon will generate enough cash to "pay back" investors for buying shares at a $170 billion market cap. After all, we should be able to see a path that will generate a return from our investment, whether it's through higher cash flow in the future or in the form of dividends or buybacks.
It turns out that if Amazon can generate a 30% return on cash it will pass $170 billion in cumulative cash flow in 2021. This is a cumulative figure, not free cash flow, but it gives us an idea just how far Amazon has to go to live up to its valuation.
Here's what I found interesting about the cumulative cash flow figure: If we assume about $0.05 of each dollar sold turns into operating cash flow, slightly above its historical average, Amazon would generate the cumulative cash flow of its current market cap about the time it passes $1 trillion in annual revenue.
Stacking up to competitors
How do competitors like Target and Wal-Mart stack up on to the same cash flow analysis? After all, an investor could choose one of these slower growing companies, who will pay them back with dividends, buybacks, and some growth.
Target currently trades at 7.7 times 2012's operating cash flow (also adjusted for payables) and if we assume 2% cash flow growth will earn back its market cap in cash near the middle of 2019. Even assuming a 2% growth rate rather than the 30% growth rate I've assumed with Amazon the company earns cash back faster than Amazon.
Wal-Mart trades at a slight premium to Target at 9.6 times adjusted operating cash flow. Using the same 2% growth rate it will earn back enough cash to generate its market cap in 2020, still before Amazon.
Here's a table with the same multiples. Remember that the calculations I've made for Amazon's multiples don't account for any stock growth between now and then.
|
Market Cap/2012 Adjusted Operating Cash Flow |
Year Market Cap is Earned Back in Cash | |
|---|---|---|
|
Amazon-2012 |
57.2 8.2 in 2018 (assuming 30% annual growth) |
2021 |
|
Target |
7.7 |
2019 |
|
Wal-Mart |
9.6 |
2020 |
It may not be an apples to apples comparison between Amazon, Target, and Wal-Mart, but this should put Amazon's cash flow, growth, and valuation into some context. Like I said above, it's difficult to value Amazon using traditional methods and I think these two methods shed some light on how much cash flow Amazon generates from what it invests and how that compares to other retail options.
Can Amazon grow 30% a year?
Here's the billion dollar question: Can Amazon generate the same 30% return on the $100 billionth dollar as it did on the $1 billionth or $10 billionth dollar it invested?
For Amazon to earn enough cash to trade at trailing multiples already earned by Target and Wal-Mart it will have to generate that kind of return until at least 2018, longer if growth or ROIC slows. Here's the problem: Growth is slowing!
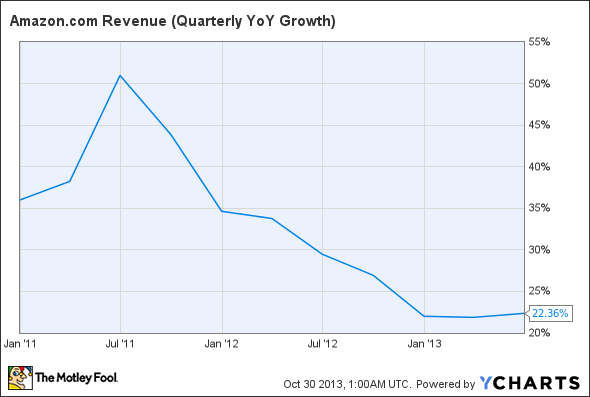
AMZN Revenue (Quarterly YoY Growth) data by YCharts
If nothing else, Amazon will run into the law of large numbers, which makes growth more challenging. To reach the figures I've projected in 2018, Amazon will have to grow to 6.7 times its revenue in 2012, or $412.1 billion. To put that into perspective, that's only slightly less than the $469.2 billion in revenue Wal-Mart generated last year.
Amazon has generated an incredible amount of cash flow from its investments, that's not what's in question. What's in question is whether or not Amazon can live up to the expectations the market has already put on future growth? It's hard to grow 30% a year when you already have $70 billion in annual sales and even harder when Amazon gets toward $200 billion or $400 billion in sales.
I will be the first to admit that I've been wrong on Amazon's stock for over a year. At the same time, the Stock Adviser Newsletter pick passed the 100-bagger point for David Gardner, an incredible win. But I can't imagine Amazon experiencing the same growth at its current size as it did as a smaller company.
In short, I simply think there's too much optimism priced into Amazon's shares. I might be wrong, as I have been for the past year, but only time will tell if Amazon can keep up this torrid growth rate. The interesting number is that it may take $1 trillion in sales, just to pay investors back for what they've already paid for the stock.