Study: How Americans Define the Middle Class
Americans have an idea of what it means to be in the middle class, or the so-called "backbone of America," but the definition is still fuzzy for something we hear so often. Even financial experts agree that the definition, size, and future of the middle class is constantly changing.
We surveyed over 1,000 Americans to get to the bottom (or middle) of the story. Respondents attempted to define the middle class by everything from its spending habits to its minimum annual household income. Read on to see how your contemporaries may view your current socioeconomic status.
Defining the American backbone

Evidently, the vast majority of Americans consider themselves to be middle class. Millennials identified with this socioeconomic status more often than any other generation, with 85.4% of those surveyed considering themselves middle class. The older respondents were, the less likely they were to identify as middle class, however: 77.4% of baby boomers surveyed self-reported as middle class, which is still more than three-quarters of the generation.

Marital status had a significant impact on respondents' perceptions of their respective classes as well: Divorced people were the least likely to perceive themselves as middle class. On the opposite end of the relationship spectrum, married respondents considered themselves to be middle class 92.9% of the time.
The meaning of middle class

Respondents shared some positive opinions concerning what it meant to be middle class. When asked to choose the top traits they perceived as middle class, the most common answer was the ability to pay bills on time. More than 80% of respondents agreed that a secure job was also a trait you needed to be considered middle class. Today, job security isn't evenly dispersed across industries, so it should be a consideration for anyone who's trying to find their career path.
Nearly 64% of respondents agreed that you needed the ability to save money to qualify as middle class in America. And almost 43% thought you should have at least $1,000 in a savings account to fit the bill for the middle class. Whether saving or investing, it's important to put some of your earnings aside for future use.
Some Americans had lower standards for the middle class. Instead of a savings account, simply having less than $5,000 in debt would qualify you as middle class for 20% of respondents. This may be the case because of how commonplace debt has become. Fortunately, there are a variety of ways to begin the process of becoming debt-free this year.
Minimum for the middle
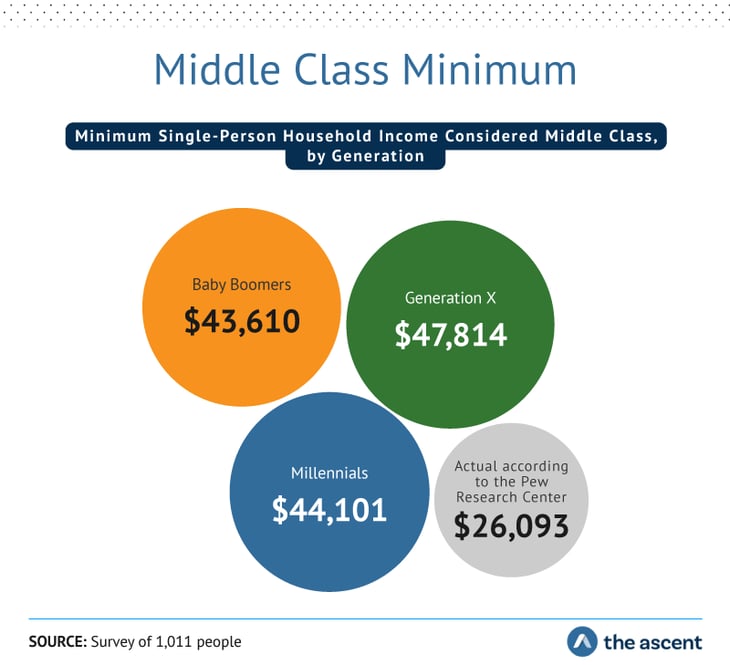
Of course, the concept of a class system evokes the question of money and exactly how much of it you have. Although respondents were in relative agreement, baby boomers had the lowest threshold for entering the middle class: They set the average single-person household income at a minimum of $43,610 to be considered middle class.
As an added frame of reference, consider that $12,490 is the current poverty line for a household of one person, according to the U.S. Department of Health and Human Services. Gen Xers nearly quadrupled that number with the highest average response of $47,814, while millennial perception fell in between the older generations'.
Middle-class checklist

Outside of household income, middle-class respondents were asked to consider their current contentment levels surrounding their job, salary, home, and car. Our study found 82.9% of the middle class was content with their car. Happiness in the home showed a slight dropoff, with 73% reporting being content with where they lived.
Of course, job and salary correlated strongly with middle-class definitions as well. Almost 73% of people reported satisfaction with their job, but only 53% were content with their salary. If asking your boss for a raise at this point in time isn't an option, remember that the money you save is often more important than the amount of money you earn.
Workweeks for the middle class

On average, workers who considered themselves middle class worked 39.2 hours per week.
Speaking only to those who considered themselves middle class, we asked about the amount of time they spent working every week. Based on the results, it seems the 40-hour workweek is still more or less standard for the average Joe or Jill. Those in the tech industry worked the longest, averaging 42.7 weekly work hours.
Logging the least hours were the arts, entertainment, and recreation industry (36.3 hours per week) and the education industry (34.9 hours per week).
A typical month for the middle class

Lastly, we gathered information as to what constituted a month in the life of the middle class, as far as expenditures were concerned. How much did they spend on everything from housing to kids and fitness? Interestingly enough, millennials spent $2,898 every month -- significantly more than their baby boomer counterparts, who spent $2,176 monthly on average. Spending more each month than any other generation, however, were Gen Xers, who averaged $3,258 in monthly expenditures.
A potential explanation for this is that millennials are generally earning wages but are not as far along in their careers as Gen Xers, many of whom are near their peak earnings potential. Meanwhile, many baby boomers are retired and living on a fixed income -- and most of them, unfortunately, have not adequately planned and saved for retirement.
Eager for earnings

Evidently, the aforementioned financial insecurity shared among our middle-class respondents comes from a common habit: living paycheck to paycheck. About 45% of our oldest respondents -- baby boomers -- lived paycheck to paycheck. Nearly 41% and 40% of Gen Xers and millennials, respectively, continued to live paycheck to paycheck as well.
Financial fear

Often more telling than paycheck size is the level of comfort certain financial statuses provide. Unfortunately, a large portion of the middle class reported financial insecurity. Almost 51% of millennials felt financially insecure. This feeling wasn't only felt by that one generation, however: 49% of Gen Xers and 43% of baby boomers felt financially insecure as well.
Summarizing the modern middle class
Ultimately, life in the middle class is pretty good, according to those on the inside. While some of our respondents are retired and no longer working, the majority of those who identified as middle class expressed widespread contentment with their occupation and salaries, among other things. The majority of participants suggested that job security and paying the bills on time were key markers of middle-class America.
Living paycheck to paycheck turned out to be a shared phenomenon in the middle class as well. As the saying goes, it's often not what you have, but what you do with it.
Methodology
For this study, we conducted an online survey of 1,011 people in the United States about their perceptions of middle class. To qualify for the questionnaire respondents must have been at least 18 years or older. Of the participants, 48.6% were female, and 51.4% were male. Participants ranged in age from 18 to 81. Only generations with a sample size of 26 or more respondents were included in the appropriate breakdowns. An attention-check question was administered throughout the survey to ensure respondents were paying attention and read through questions thoroughly. If a participant failed to answer an attention-check question correctly or entered inconsistent data throughout the survey, they were ejected from the study. Some answer options may have been grouped, or bucketed, and relabeled for clarity. Data were weighted to the 2017 Bureau of Labor Statistics data for the gender and age of Americans.
Respondents were asked how satisfied they were with the following: current job, current salary, current living situation, and current vehicle. They were given the following options:
- Completely dissatisfied
- Mostly dissatisfied
- Somewhat dissatisfied
- Neither dissatisfied nor satisfied
- Somewhat satisfied
- Mostly satisfied
- Completely satisfied
These were then consolidated into three groups in the final project: dissatisfied, neither dissatisfied nor satisfied, and satisfied.
Alert: our top-rated cash back card now has 0% intro APR until 2025
This credit card is not just good – it’s so exceptional that our experts use it personally. It features a lengthy 0% intro APR period, a cash back rate of up to 5%, and all somehow for no annual fee! Click here to read our full review for free and apply in just 2 minutes.
Our Research Expert
We're firm believers in the Golden Rule, which is why editorial opinions are ours alone and have not been previously reviewed, approved, or endorsed by included advertisers. The Ascent does not cover all offers on the market. Editorial content from The Ascent is separate from The Motley Fool editorial content and is created by a different analyst team.
Related Articles
View All ArticlesBy: Ben Gran | Published on Jan. 26, 2024
By: Steven Porrello | Published on Feb. 28, 2024
By: Ben Gran | Published on Feb. 27, 2024
By: Maurie Backman | Published on Feb. 27, 2024
By: Chris Neiger | Published on March 2, 2024