Updated
PERT and Gantt charts are tools that illustrate project tasks and their dependencies. They are essential for communicating and managing projects, but there are some differences between them.
The project management process involves a lot of moving parts and hundreds, if not thousands, of data points to capture, track, and manipulate. There are many ways critical information can slip through the cracks.
To counter that, project managers use tools and techniques to keep things organized and flowing smoothly. One time-tested project management best practice is to use visualization tools to map out a project from beginning to end.
Two of the most discussed visual project tools are Gantt and PERT charts. Both outline the project’s tasks and their dependencies, but they differ in many ways. In this guide, we’ll discuss what each chart is for, their benefits and limitations, and when to use them.
Overview: What is a PERT chart?
A PERT chart is a flow chart or network diagram that uses boxes or circles, lines, and arrows to put a project into perspective. It helps project managers organize, schedule, and coordinate project tasks.
PERT is an acronym for program evaluation and review technique, and PERT charts were first introduced in the 1950s by the U.S. Navy.
A PERT chart typically includes these elements:
- Nodes are numbered boxes or circles that represent the project’s major events or milestones.
- Vectors are labeled lines representing project tasks. Numbers indicate the time allotted for each task.
- Directional arrows illustrate task sequences. Tasks that must be completed sequentially are called dependent or serial tasks.
- Diverging arrows may show concurrent or parallel tasks that are independent of other tasks.
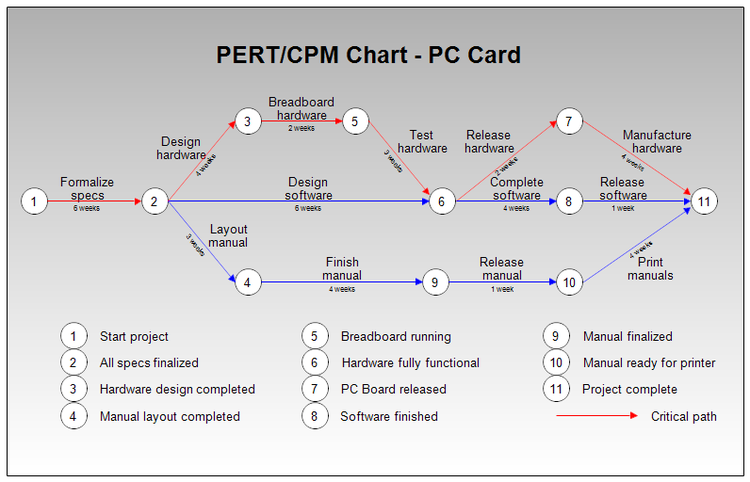
Here’s what a PERT chart looks like.

The legend at the bottom explains the symbols or markings used in the chart that the reader may not be familiar with. Image source: Author
Here’s a much simpler PERT chart example.
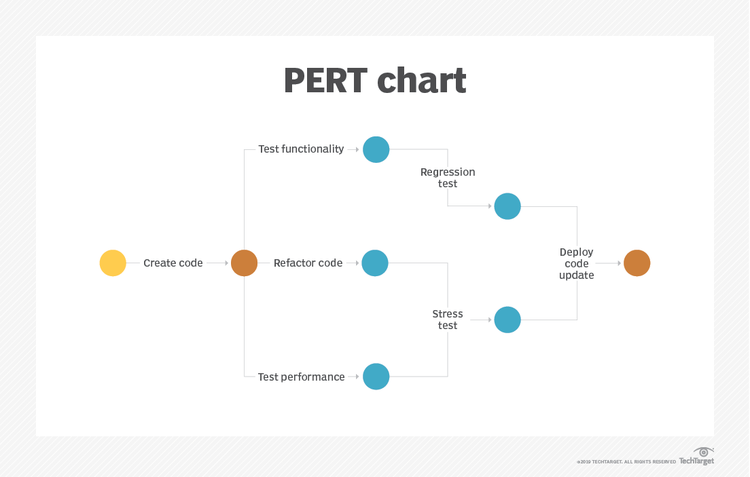
Here, we see the tasks to be performed sequentially and which tasks can occur concurrently. Image source: Author
Benefits and disadvantages of using PERT charts
PERT charts come with noteworthy advantages, including:
- Predict realistic deadlines: The PERT approach averages three timeline estimates to factor in all forms of uncertainties when calculating task due dates: optimistic time (shortest), pessimistic time (longest or worst case), and the most likely time (most probable).
- Never lose sight of milestones and major project events: A PERT chart is built around project milestones and significant events. Nodes represent each of them, so you can stay on top of things that matter.
- Better visualize projects: Get a bird’s eye view of the project. Identify its scope and potential bottlenecks. See all the associated tasks, including the dependencies and relationships between individual tasks, the sequence of activities, and their estimated durations.
- Identify the project’s critical path: A project’s critical path is the stretch of dependent activities with the longest duration. The time it takes to complete this path, with or without float (also referred to as slack, which is the amount of time a task can be delayed without delaying subsequent tasks or the project overall), is the shortest possible time to complete the project. Any delay, including a delay in the completion of a predecessor activity, will delay project delivery. Closely monitoring the critical path is vital to keeping the project on schedule.
This PERT chart shows the project’s critical path. Image source: Author
PERT chart disadvantages or limitations include the following:
- Too much emphasis on the critical path: A keen focus on the critical path is vital for projects to stay on schedule. But putting all your team’s attention on it may lead you to neglect other paths or task relationships.
- Labor-intensive, by nature: Creating a PERT chart that makes sense for everyone takes time, planning, resources, and skill. For the chart to remain usable, it must be constantly maintained, reviewed, and updated.
- Can get complicated over time: The PERT chart may become difficult to follow, particularly if you’re working on a complex, long-term project with hundreds of tasks.
Overview: What is a Gantt chart?
A Gantt chart uses bars on a timeline to monitor and keep the project’s schedule under control. A Gantt chart schedule provides information on:
- Which tasks need to be completed and when
- The length of time allotted for each task
- Milestones, which mark landmark events, such as patent approvals, contract signing, or the completion of major project deliverables
- Interdependencies between tasks to understand which tasks must be completed before another task can begin
- Tasks that are happening at the same time
- Project progress in terms of where you are now vs. the project schedule
When created using Gantt chart software such as TeamGantt or Microsoft Project, your scheduling chart will look something like this:
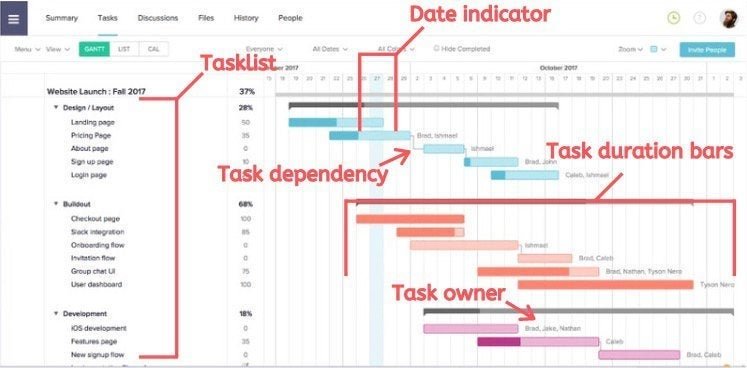
A Gantt chart shows the project’s different tasks, their duration, start and end dates, the dependencies between tasks, and the persons responsible for each task. Image source: Author
Benefits and disadvantages of using Gantt charts
Gantt charts, like most project management tools, have specific uses. Done right, they provide many advantages, including:
- Keep everyone on the same page: Communicate expectations and critical dates to the project team using visual elements, such as bars, lines, arrows, and special shapes or symbols (e.g., diamonds for milestones).
- Create realistic timelines: With task durations represented by the length of each Gantt bar, set reasonable timeframes for tasks and the project overall.
- Better resource management: Know which resources are assigned to tasks, and better manage your project’s tools, equipment, and manpower skills.
- Identify bottlenecks and potential problems: Gantt charts highlight delays, task overlaps, resource overloads, and activities that consume too much time.
While extremely useful, Gantt charts also have some disadvantages:
- Need consistent updating and monitoring: Gantt charts are useful only if the information they communicate is current. Otherwise, they may fuel chaos and confusion.
- Can easily become complex: Gantt charts are visual aids for project execution, monitoring, and control. But when working on multiple projects simultaneously, things can get complicated fast. As such, at least one person -- preferably someone with an eye for detail -- may have to dedicate time each day to update your Gantt charts.
- Unclear amount of work per task: Gantt bar lengths only show the duration of each task but not how much work is required to complete the task.
PERT chart vs. Gantt chart: When should you use each?
Before we get to that, let’s first take a look at this comparison image created by my colleague Nick:
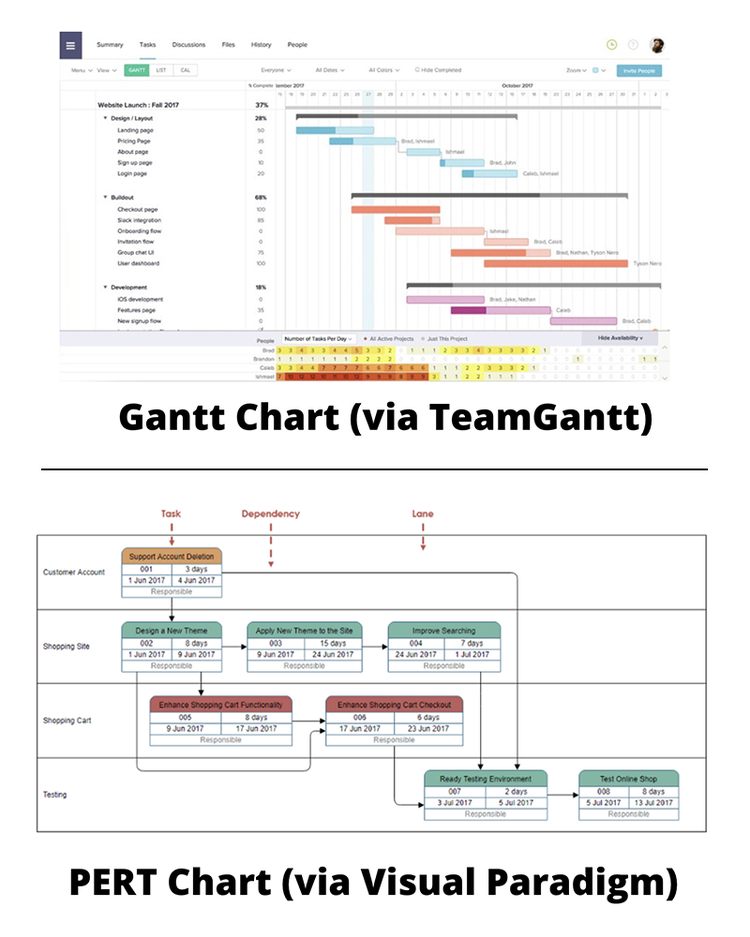
Although both the Gantt chart on top and the PERT chart at the bottom can show the same type of information, they’re very different structurally. Image source: Author
As you can see, both the PERT chart and Gantt chart illustrate the project’s tasks, durations, dependencies, and persons responsible. The primary difference is the way they present the information.
Considering the Gantt and PERT chart pros and cons we laid out above, when is it better to use a PERT chart instead of a Gantt chart, and vice versa?
When to use Gantt charts
Gantt charts contain vital scheduling, task, and resource information, which means they’re best used during the execution phase for:
- Task tracking
- Due dates monitoring
- Spotting bottlenecks
- Staying on top of milestones and task dependencies
- Understanding the project’s direction from start to finish
Gantt charts also illustrate your project’s progress against the plan. Therefore, they’re essential for monitoring plan deviations that can derail the project, so you can make the necessary corrective actions to put it back on track.
When to use PERT charts
PERT charts are best used during the planning phase, for a number of reasons:
- To get the project’s scope right
- To illustrate the relationships between tasks -- which task groups must be completed sequentially and which can be performed simultaneously
- To calculate task durations without showing the actual dates
- To pinpoint the project’s critical path, so you can realistically estimate how long the entire project will take to complete
Creating a PERT chart takes time and resources. It’s a labor-intensive process. And since project changes occur frequently, making significant alterations to your PERT chart mid-project may not be possible. As a result, your PERT chart will no longer accurately illustrate the current state of the project.
PERT and Gantt charts -- visual tools for streamlining project management
Keeping communication healthy and effective is one project management principle good project managers live by. With PERT and Gantt charts, you have essential visual tools to communicate complex plans, illustrate task connections, and keep everyone on the same page.
To get started with Gantt charts, take a look at some of the best project management software options The Ascent has reviewed so far. As for PERT charts, Visual Paradigm, Lucidchart, and Creately are PERT chart creator tools worth considering. All three come with a PERT chart template library.
Our Small Business Expert
Maricel Rivera is a business writer and researcher who has worked with the content teams of multiple B2B software companies. Some of her work appear on sites like Yahoo Small Business, Business.com, and Business2Community. When not writing, she’s most likely spending her time making something out of yarn.
Share This Page
We're firm believers in the Golden Rule, which is why editorial opinions are ours alone and have not been previously reviewed, approved, or endorsed by included advertisers. The Ascent, a Motley Fool service, does not cover all offers on the market. The Ascent has a dedicated team of editors and analysts focused on personal finance, and they follow the same set of publishing standards and editorial integrity while maintaining professional separation from the analysts and editors on other Motley Fool brands.
The Motley Fool has a disclosure policy.