Accessibility Menu
Pacific Biosciences Of California logo

Pacific Biosciences Of California

(NASDAQ) PACB

Current Price$1.44
Market Cap$462.80MMarket cap calculated using publicly traded shares outstanding only. Does not include unlisted, private, or dual-class non-traded shares. Implied market cap may vary.
Since IPO (2010)-91%
5 Year-94%
1 Year+0%
1 Month+10%
Pacific Biosciences Of California last closing stock price
MetricPriceDate
Last closeUSD 1.492026-07-16
Pacific Biosciences Of California stock price return by period
PeriodPrice returnPrice at period startPeriod start date
1 week-7.45%USD 1.612026-07-09
1 month+10.37%USD 1.352026-06-16
3 month-11.83%USD 1.692026-04-17
Year to date-20.32%USD 1.872025-12-31
1 year+0%USD 1.492025-07-16
3 year-89.3%USD 13.932023-07-17
5 year-94.37%USD 26.482021-07-16
Since inception-90.94%USD 16.442010-10-27

Pacific Biosciences Of California Financials at a Glance

Market Cap

$462.80MMarket cap calculated using publicly traded shares outstanding only. Does not include unlisted, private, or dual-class non-traded shares. Implied market cap may vary.

Revenue (TTM)

$160.03M

Net Income (TTM)

-$128.58M

EPS (TTM)

-$0.43

P/E Ratio

-3.49

Dividend

$0.00

Beta (Volatility)

2.39 (High)

Price

$1.44

Volume

7,077,175

Open

$1.45

Previous Close

$1.44

Daily Range

$1.43 - $1.49

52-Week Range

$1.09 - $2.73

Estimated Earnings Date

Aug 3, 2026

PACB: Motley Fool Moneyball Superscore

43

Our CEO Is Handing Members His Secret Weapon

It's called Motley Fool Moneyball, our new proprietary AI tool

We spent over half a million dollars in R&D to build a tool that makes stock research faster, sharper, and smarter. Our analysts use it every day, and now, you can too.

Get Access Now

About Pacific Biosciences Of California

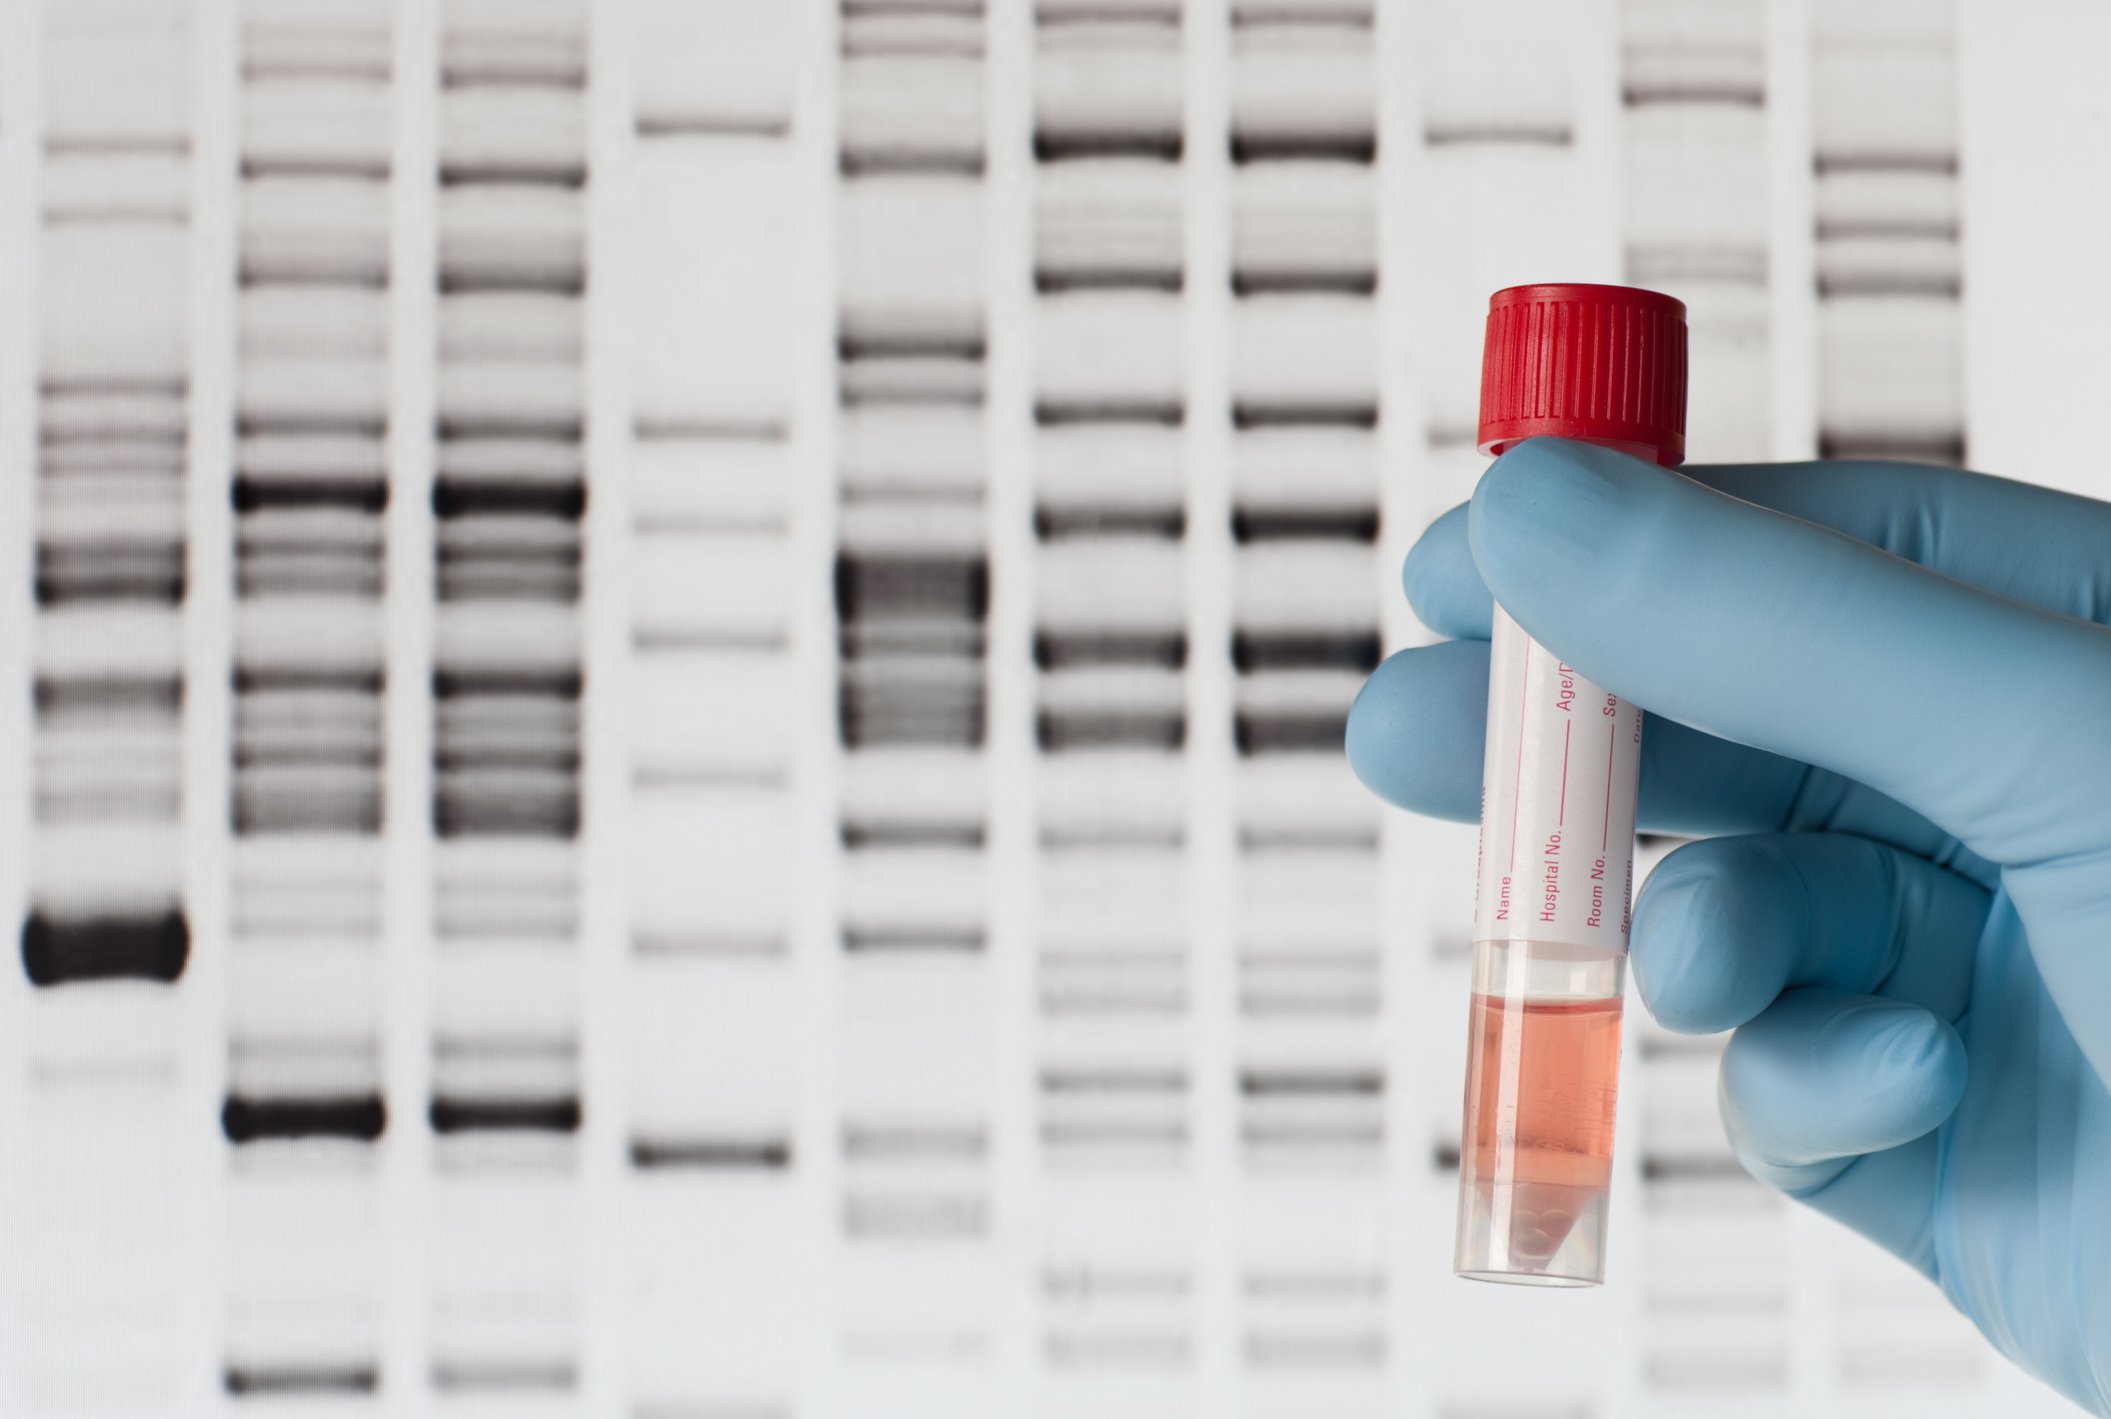
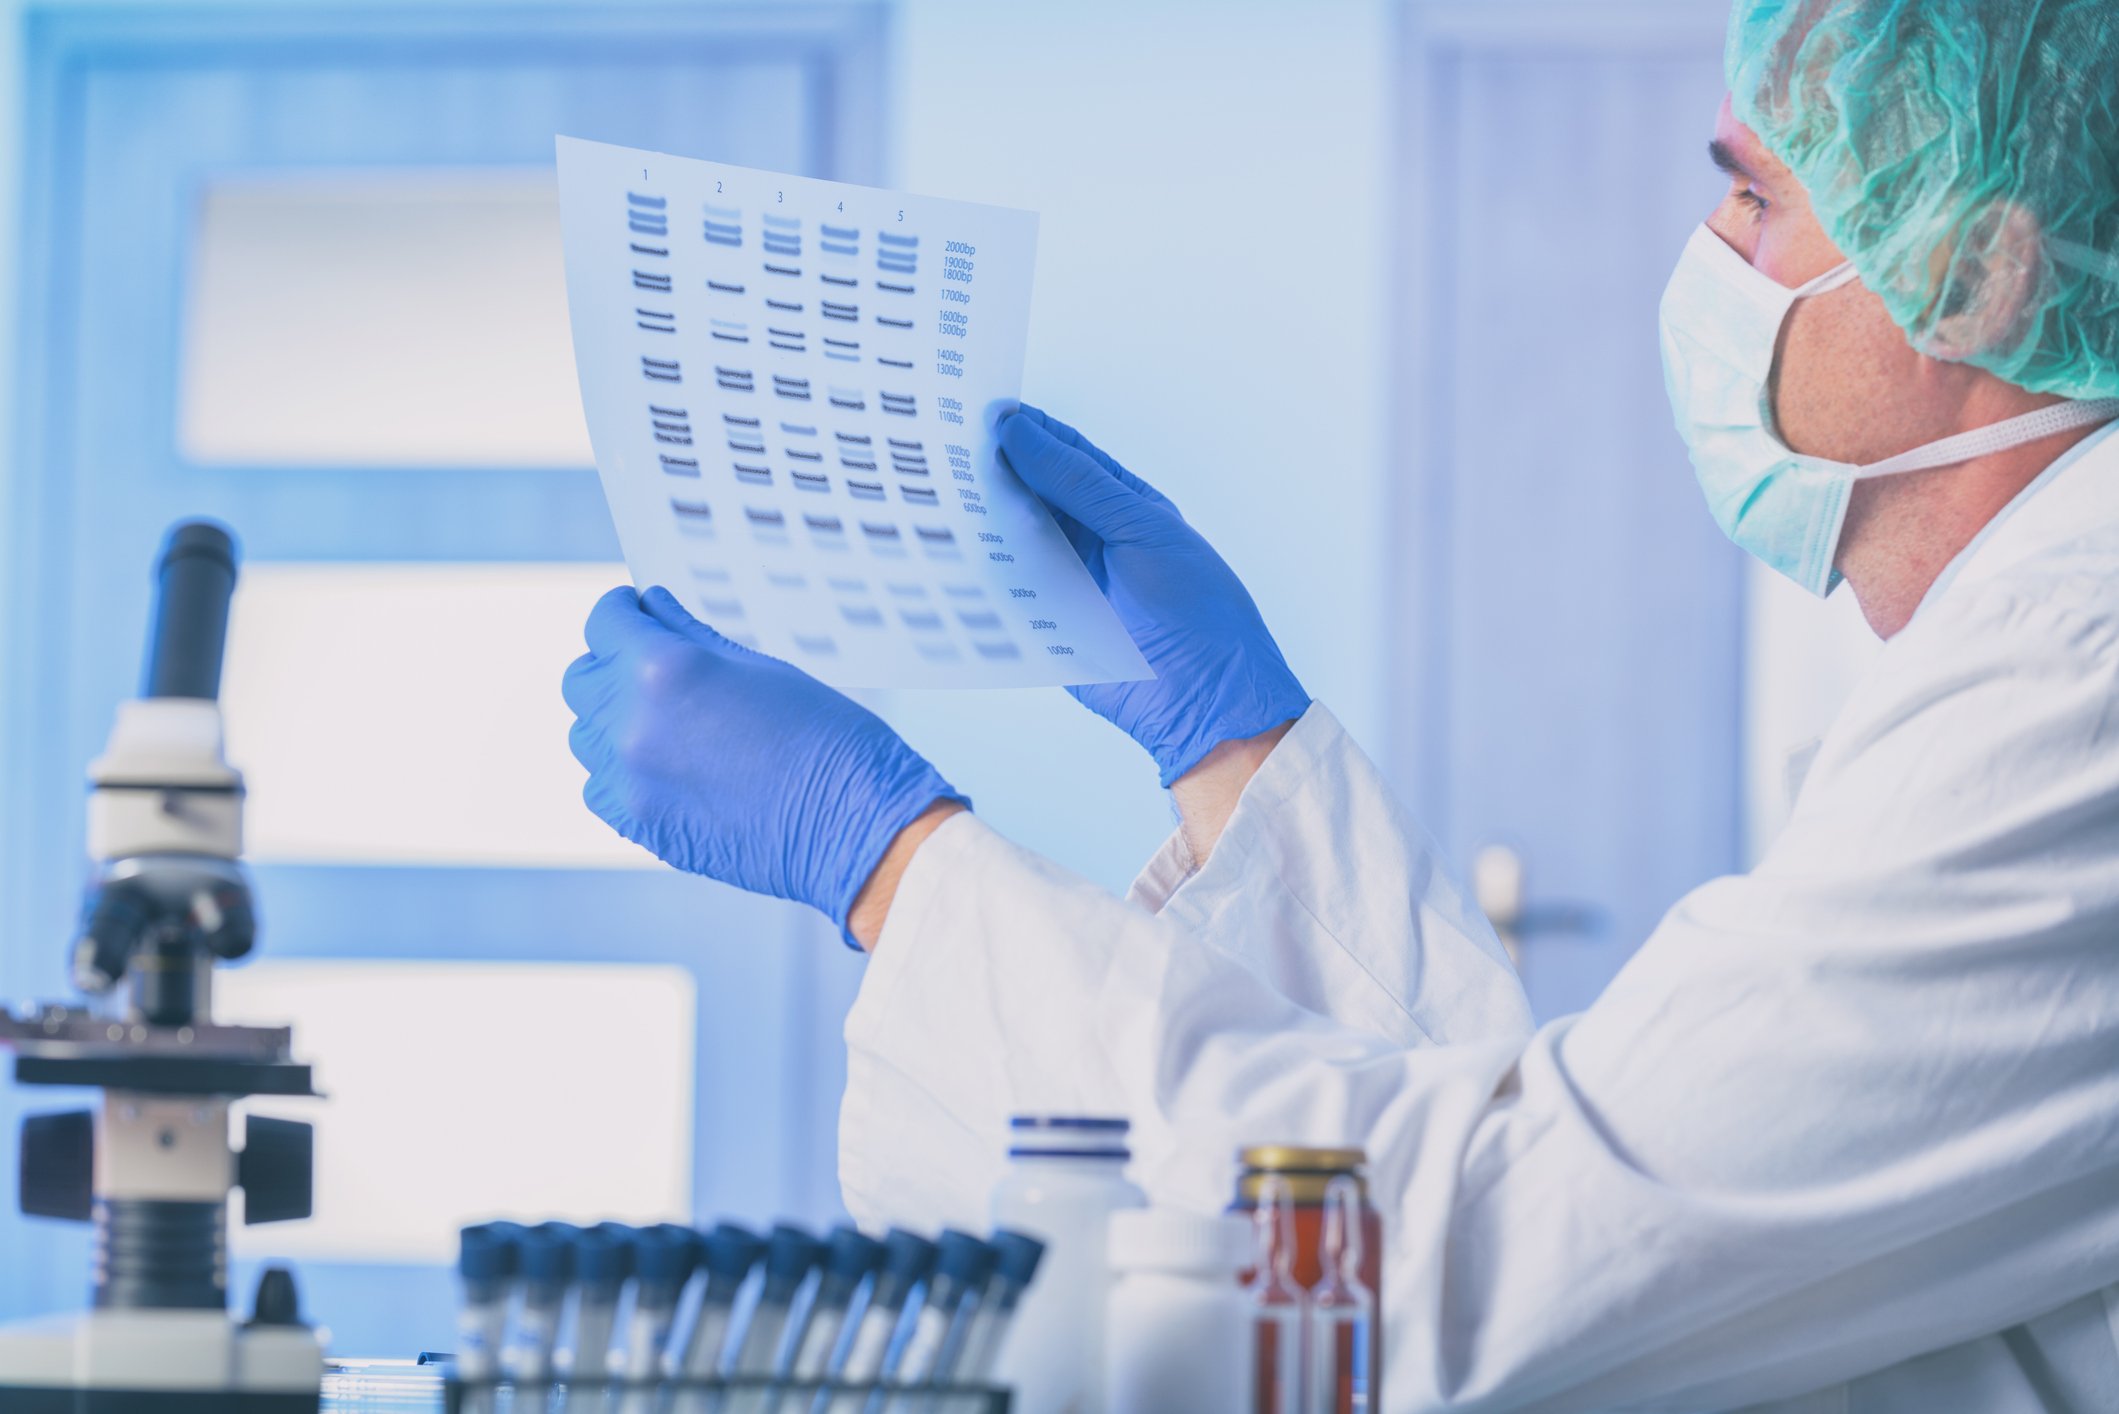
PacBio makes advanced machines that help scientists read DNA very accurately. These tools help doctors and researchers solve complex genetic health problems. The company serves labs, hospitals, and drug companies around the world.

What Is in the Lab?

  • Sequencing Systems: Instruments like Revio and Vega that monitor DNA reactions in real time.
  • Consumable Products: Single-use items like SMRT Cells and reagent kits needed to run the machines.
  • Kitted Solutions: Ready-to-use kits like Kinnex for RNA sequencing and PureTarget for specific genetic tests.

Growth and Strategic Moves

  • Completed a $50 million asset sale to Illumina Cambridge Limited in January 2026 involving short-read DNA technology.
  • Acquired Apton Biosystems, Inc. in August 2023 to expand its technology portfolio.
  • Collaborated with Invitae Corporation for development and commercialization projects.
  • Launched the Vega benchtop system in the fourth quarter of 2024 to reach more customers.

Why the Technology Is Unique

The company uses Single-Molecule Real-Time (SMRT) technology to provide a complete view of the genome. Its systems can detect chemical changes in DNA without extra steps, offering more detail than standard tools.

A Look at the Numbers

  • Revenue reached $44.6 million in Q4 2025, up 13.8% from $39.2 million in Q4 2024.
  • Gross profit hit $16.7 million in Q4 2025, up 66.5% from $10.1 million in Q4 2024.
  • Operating income was -$41.2 million in Q4 2025, which improved from -$153.0 million in Q4 2024.
  • Net income turned negative at -$40.4 million in Q4 2025, which worsened from a $2.4 million profit in Q4 2024.
  • Free cash flow was -$24.9 million in Q4 2025, which improved from -$32.3 million in Q4 2024.

Wrapping Up

PacBio has shifted from a research-only focus to providing high-accuracy tools for clinical and industrial use. The company continues to refine its technology while streamlining its business through strategic asset sales and cost-reduction plans.

AI Generated • May 6, 2026

Industry

Life Sciences Tools and Services

Employees

485

CEO

Christian O. Henry, MBA

Headquarters

Menlo Park, CA 94025, US

PACB Financials

Key Financial Metrics (TTM)

Gross Margin

37.08%

Operating Margin

-101.72%

Net Income Margin

-80.34%

Return on Equity

-488.45%

Return on Capital

-72.90%

Return on Assets

-16.43%

Earnings Yield

-28.65%

Dividend Yield

0.00%

Payout Ratio

0.00%

Stock Overview

Market Cap

$462.80MMarket cap calculated using publicly traded shares outstanding only. Does not include unlisted, private, or dual-class non-traded shares. Implied market cap may vary.

Shares Outstanding

310.60M

Volume

7.08M

Avg. Volume

6.20M

Financials (TTM)

Gross Profit

$59.34M

Operating Income

-$162.78M

EBITDA

-$106.60M

Operating Cash Flow

-$111.84M

Capital Expenditure

-$4.37M

Free Cash Flow

-$116.21M

Cash & ST Invst.

$275.98M

Total Debt

$703.39M

Pacific Biosciences Of California Performance Analysis

Pacific Biosciences Of California annual revenue and year-over-year revenue growth by fiscal year
Fiscal yearPeriod endRevenueYoY growth
20222022-12-31USD 128,304,000-1.7%
20232023-12-31USD 200,521,00056.3%
20242024-12-31USD 154,014,000-23.2%
20252025-12-31USD 160,005,0003.9%
Pacific Biosciences Of California sequential (quarter-over-quarter) revenue growth by fiscal quarter
Fiscal quarterPeriod endQoQ growth
Q22025-06-307.0%
Q32025-09-30-3.3%
Q42025-12-3116.1%
Q12026-03-31-16.7%
Pacific Biosciences Of California annual diluted earnings per share and year-over-year EPS growth by fiscal year
Fiscal yearPeriod endDiluted EPSYoY growth
20222022-12-31USD -1.4057.6%
20232023-12-31USD -1.21-13.6%
20242024-12-31USD -1.5931.3%
20252025-12-31USD -1.8214.7%
Pacific Biosciences Of California sequential (quarter-over-quarter) diluted earnings per share growth by fiscal quarter
Fiscal quarterPeriod endQoQ growth
Q22025-06-3090.3%
Q32025-09-307.1%
Q42025-12-31N/A
Q12026-03-3176.9%

Revenue Growth Rate

Annual and quarterly growth comparison

Earnings Per Share Growth Rate

Annual and quarterly EPS growth comparison

Quarterly Performance

Name
Q1 2026YOY CHG

Revenue

$37.18M

+0.1%

Gross Profit

$12.84M

+1036.6%

Gross Margin

34.54%

N/A

Market Cap

$462.80MMarket cap calculated using publicly traded shares outstanding only. Does not include unlisted, private, or dual-class non-traded shares. Implied market cap may vary.

N/A

Market Cap/Employee

$954.22K

N/A

Employees

485

N/A

Net Income

-$8.28M

+98.1%

EBITDA

-$5.77M

+88.9%

Quarterly Fundamentals

Name
Q1 2026YOY CHG

Total Cash

$275.98M

-19.6%

Total Debt

$703.39M

+0.6%

Accounts Receivable

$29.35M

-7.3%

Inventory

$51.02M

-5.5%

Long Term Debt

$703.11M

+0.9%

Short Term Debt

$277.00K

-88.5%

Return on Assets

-16.43%

N/A

Return on Invested Capital

-22.70%

N/A

Free Cash Flow

-$47.73M

+5.4%

Operating Cash Flow

-$44.69M

-1.4%

Other Investments to Explore

People Also Watch

Symbol / CompanyPricePrice Chg
OFIXOrthofix Medical Inc.
$11.58-2.61%
DNAGinkgo Bioworks Holdings, Inc.
$7.91-4.58%
FLGTFulgent Genetics, Inc.
$20.16-1.90%
SIBNSI-BONE, Inc.
$17.38-1.92%

Trending Stocks

Symbol / CompanyPricePrice Chg
ONDSOndas
$6.53-0.02%
AALAmerican Airlines Group
$14.98-0.04%
NFLXNetflix
$68.95-0.07%
PATHUiPath
$12.15+0.01%

Questions About PACB

What is the current price of Pacific Biosciences Of California?

Pacific Biosciences Of California is trading at $1.44 per share.

What is the 52-week range for Pacific Biosciences Of California?

Over the past 52 weeks, Pacific Biosciences Of California has traded between $1.09 and $2.73.

How much debt does Pacific Biosciences Of California have?

As of the most recent reporting period, Pacific Biosciences Of California reported total debt of $703.39M.

How much cash does Pacific Biosciences Of California have on hand?

Pacific Biosciences Of California reported $56.29M in cash and cash equivalents in its most recent financial results.

What is Pacific Biosciences Of California’s dividend yield?

Pacific Biosciences Of California does not currently have a dividend yield.

Premium Investing Services

Invest better with The Motley Fool. Get stock recommendations, portfolio guidance, and more from The Motley Fool's premium services.