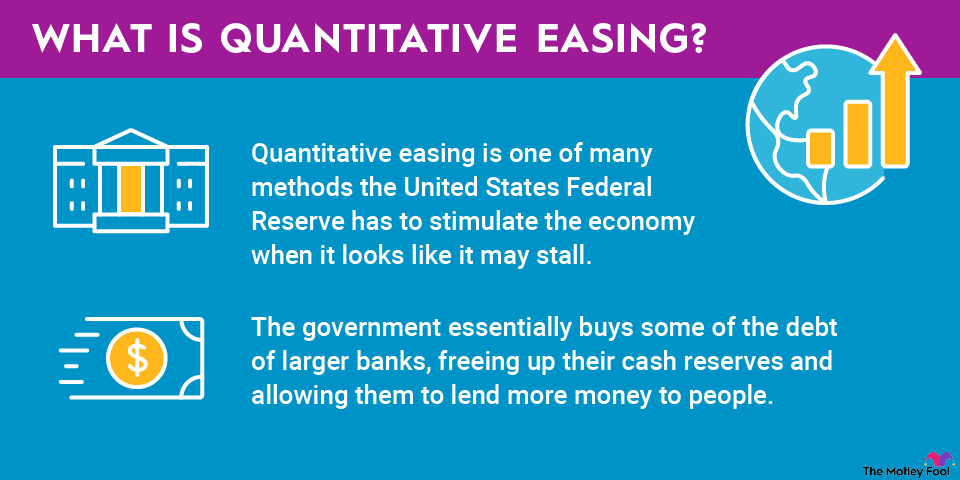
Loading paragraph...
Loading image...
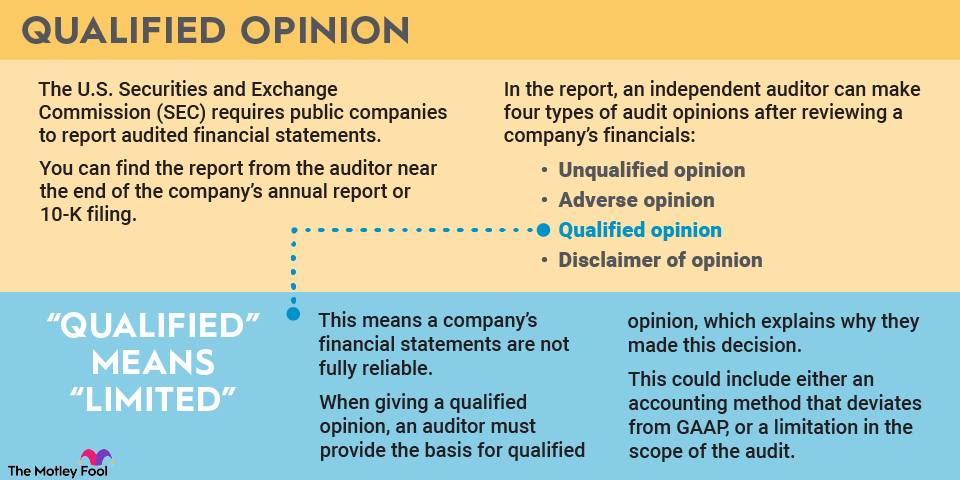
Loading paragraph...
Loading paragraph...
Loading paragraph...
Loading hub_pages...
Loading paragraph...
About the Author

Lee Samaha is a contributing Stock Market Analyst at The Motley Fool covering industrials, electricals, energy, materials, transportation, and infrastructure stocks.
Prior to The Motley Fool, Lee was a Civil Engineer and Investment Manager.
He holds a Bachelor of Civil and Structural Engineering from Southampton University and a Certificate in Investment Management from Chartered Institute for Securities & Investment.
Lee first cut his investing teeth on The Motley Fool bulletin boards (commonly referred to as the “Fool Boards,”) and he’s infinitely grateful to all of the investors he learned from in this powerful investing community.
The Motley Fool has a disclosure policy.