Auditing America's Financial Health
After years of improvement, America's financial health has declined. Factors include difficulty paying bills, unpredictable income changes, increased credit card debt, inability to access credit, and not being prepared for an economic slowdown.
That's according to the Consumer Financial Protection Bureau, which since 2019 has surveyed Americans on a variety of financial issues to measure America's financial well-being.
The Consumer Financial Protection Bureau (CFPB) defines financial well-being as "a state of being wherein a person can fully meet current and ongoing financial obligations, can feel secure in their financial future, and is able to make choices that allow them to enjoy life."
CFPB's financial well-being scores fall on a 0 to 100 scale, with a higher score indicating better financial well-being.
The average financial well-being score in February 2022 was 51.1, down from 52.4 in February 2021.
Financial well-being varies significantly by race, education, age, and income.
We partnered with Charlie Pastor, CFP and contributing personal finance expert with Motley Fool Money, to audit America's financial well-being. Read on for an in-depth look at America's financial health.
Jump To
- Financial well-being scores by race, education, age, and income
- 47% of Americans with a credit card have revolving debt
- Credit card debt and credit availability by race, education, age and income
- 53% of Americans could cover expenses for less than three months if they lost their main income
- 36% of households have had recent difficulty paying bills
- Emergency savings and financial stability by race, education, age and income
- FAQs
America's average financial well-being score: 51
| Feb 2022 | Feb 2021 | June 2019 | |
|---|---|---|---|
| Overall | 51.1 | 52.4 | 51 |
America's average financial well-being score declined in February 2022 to 51.4, down from 52.4 the prior year.
The score increased between 2019 and 2021. This is likely due to COVID-19 pandemic relief supporting household finances, alongside robust economic growth that began in the spring of 2019.
Given that inflation took off in mid-2021 it's logical that consumers have experienced a decline in financial security. Inflation for housing, transportation, and food -- the largest monthly expenses for Americans -- was well above average for most of 2021 and a large part of 2022.
"Considering the variety of factors working against Americans between early 2021 and 2022, a drop in the financial well-being score of just under one and a half points doesn't concern me much," said Charlie Pastor, CFP and contributing personal finance expert with Motley Fool Money.
Pastor isn't let down by the slight decrease in financial well-being score. "A moderate decrease in the financial well-being score of Americans amid tightening on both sides of the cash flow equation is a hopeful sign to me, and a testament to the resiliency of the American people," he said.
Financial well-being scores by race, education, age, and income
Financial well-being scores vary significantly by race, education, age, and income.
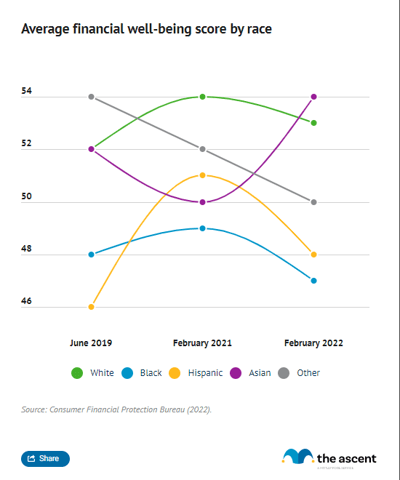
Asian Americans were the only group to see their financial well-being score increase from February 2021 to February 2022. They also posted the highest score, while Black and Hispanic respondents posted the lowest scores.
Average financial well-being score by race
| Race | Feb 2022 | Feb 2021 | June 2019 |
|---|---|---|---|
| White | 53 | 54 | 52 |
| Black | 47 | 49 | 48 |
| Hispanic | 48 | 51 | 46 |
| Asian | 54 | 50 | 52 |
| Other | 50 | 52 | 54 |
Financial health tracks with education. Those with at least a college degree had an average financial well-being score of 57, unchanged from 2021. All other respondents had scores below 50 and experienced a decline from the previous year.
Average financial well-being score by education
| Education level | Feb 2022 | Feb 2021 | June 2019 |
|---|---|---|---|
| High school or less | 46 | 49 | 47 |
| Some college but no degree | 48 | 51 | 50 |
| Two-year college or vocational | 49 | 50 | 49 |
| College or postgraduate | 57 | 57 | 55 |
Age and income also factor into financial well-being. Respondents over 40 posted average scores over 50, while those under 40 had an average score of 48. Notably, Americans over 61 years old saw their average financial well-being score decline from 57 to 54.
Financial health scales with income. Those making $50,000 or less had average scores below 50 while those making over $125,000 posted an average score of 62. The latter group was the only one to see their score increase from 2021 to 2022.
47% of Americans with a credit card have revolving debt
Among Americans that have a credit card, 47% have revolving debt -- a balance on their credit card that is carried from month to month -- and may be charged interest on.
Respondents had an average credit card debt of $4,773.
| Has a credit card | Revolving debt (if have a credit card) | Credit card debt | |
|---|---|---|---|
| Overall | 80.2% | 47% | $4,773 |
Credit card debt declined when the COVID-19 pandemic began and continued to fall as stimulus checks were distributed. Beginning in 2022, however, credit card debt has risen alongside inflation.
"For many Americans, a credit card may be the 'loan of last resort,'" said Charlie Pastor, CFP and contributing financial expert with Motley Fool Money. " Americans who have thus far avoided credit card debt should remain defensive financially by building an emergency fund."
Whether consumers applied for a credit or loan in the last year
| Applied | Turned down or did not receive as much credit as applied for | Decided not to apply because anticipated being turned down | |
|---|---|---|---|
| Overall | 44% | 22% | 24% |
Despite rising credit card debt, 44% of Americans applied for credit or a loan in the 12 months leading to February 2022.
Twenty-four percent opted not to apply for credit because they expected to be turned down and 22% were either turned down outright or received less credit than they applied for -- all outcomes that could further strain finances.
Credit card debt and credit availability by race, education, age and income
Access to credit as well as credit card usage and debt differ across demographic groups.
For example, Black and Hispanic Americans are significantly less likely than White or Asian Americans to have a credit card. Yet over 50% of Black and Hispanic Americans that do have a credit card carry revolving debt while under 50% of White or Asian Americans have credit card balances left over from previous months.
| Race | Has a credit card | Revolving debt (if have a credit card) | Credit card debt |
|---|---|---|---|
| White | 83% | 44% | $4,731 |
| Black | 65% | 62% | $4,002 |
| Hispanic | 73% | 58% | $4,683 |
| Asian | 95% | 31% | $6,540 |
| Other | 84% | 53% | $5,395 |
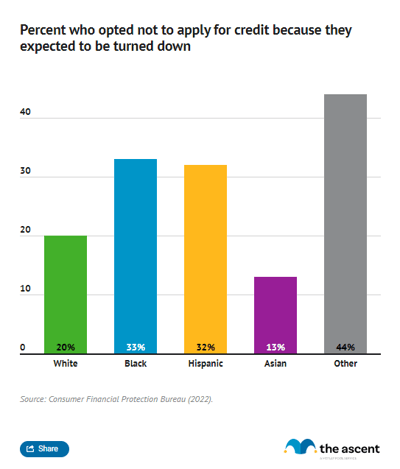
While applications for credit were similar across race, Black and Hispanic Americans were more likely to be turned down, receive less credit than requested, or simply not apply for credit because they expected to be turned down.
Whether consumers applied for a credit or loan in the last year
| Race | Applied | Turned down or did not receive as much credit as applied for | Decided not to apply because anticipated being turned down |
|---|---|---|---|
| White | 43% | 20% | 20% |
| Black | 49% | 30% | 33% |
| Hispanic | 48% | 25% | 32% |
| Asian | 29% | 9% | 13% |
| Other | 54% | 29% | 44% |
Americans with a high school degree or less also face credit challenges. Just 57% have a credit card, though they carry relatively low credit card debt and only 42% have a revolving balance. However, 35% were turned down for credit or received less than they applied for, and another 35% opted not to apply for credit because they assumed they would be rejected, higher percentages in both categories than any other group.
Similarly, Americans under 40 are most likely to have their credit request turned down or lowered (31%) or not apply (38%) compared to older Americans.
Americans aged 40 to 61 however were the most likely to have a revolving credit card balance (55%) and had roughly double the amount of credit card debt ($7,354) than younger and older Americans.
The higher income a household has, the more likely they are to have a credit card and the less likely they are to carry a revolving balance, generally speaking. Higher income households also carry more credit card debt.
Income also tracks credit availability. Higher income households were less likely to be turned down for credit or counter offered at a lower amount, and were less likely to opt not to apply for credit because they expected to be rejected.
Credit can be a double-edged sword -- having access to it can help households navigate difficult financial situations but overreliance on credit can saddle families with high-interest debt.
53% of Americans could cover expenses for less than three months if they lost their main income
The majority of American households, 53%, are unable to cover expenses for more than three months if its main source of income were to be lost, according to CFPB. That's up one percent from May 2019.
Twenty-one percent would be unable to cover expenses for a month.
If your household lost its main source of income, about how long could you cover expenses?
| Amount of time able to cover expenses | Feb 2022 | May 2019 |
|---|---|---|
| Less than two weeks | 21% | 20% |
| About one month | 17% | 18% |
| About two months | 15% | 14% |
| Three to six months | 21% | 18% |
| More than six months | 27% | 29% |
An emergency savings fund to cover three months of expenses in the event of income loss is generally considered to be the minimum recommendation, so it's concerning that only 47% of households have that level of savings.
"The saving rate of the average American is a concern even during good economic conditions," said Charlie Pastor, CFP and contributing financial expert for Motley Fool Money.
"While experts generally agree that a suitable emergency fund is equal to between three and six months of expenses, Americans should adjust that amount regularly to reflect economic outlook and personal circumstances," he added.
Twenty-one percent of households report having an emergency fund to cover three to six months of expenses, which is the typical range of emergency savings that is generally recommended.
Having more than six months of emergency savings, something that 27% of households have achieved, is difficult to attain due to the amount of money that is required. Amassing that level of savings could also require reducing contributions to a retirement account or brokerage account.
36% of households have had recent difficulty paying bills
Making saving more difficult, 36% of households report having difficulty paying bills in the year leading up to February 2022. That's up 2% from February 2021, but down 4% from 2019.
Percent with difficulty paying bills or expenses in the previous year
| Feb 2022 | Feb 2021 | June 2019 | |
|---|---|---|---|
| Overall | 36% | 34% | 40% |
Ninety percent of households had trouble paying for their bills more than once in the year prior to February 2022. Seventy-one percent had a hard time paying bills more than three times.
If your household had difficulty paying for a bill or expense in the last 12 months, how often did you have trouble?
| Once | 10% |
|---|---|
| 2 times | 19% |
| 3 or 4 times | 37% |
| 5 to 12 times | 21% |
| More than 12 times | 13% |
The most common expense households had trouble paying for was utilities, followed by car or vehicle repairs.
That those categories caused households trouble is not a shock, given the rising prices of energy and car parts since mid-2021.
Expense respondents had difficulty paying for most recently
| Utilities | 70% |
|---|---|
| Car or vehicle repair | 60% |
| Other regular household expenses | 60% |
| Mortgage or rent | 56% |
| Food | 51% |
| Medical expense | 44% |
| Home repair | 38% |
Income variability is also higher than levels recorded in 2021 and 2019, making it more difficult for households to save and manage both recurring and unpredictable expenses.
Percent whose income varies somewhat or a lot
| Feb 2022 | Feb 2021 | June 2019 | |
|---|---|---|---|
| Overall | 34% | 26% | 24% |
Emergency savings and financial stability by race, education, age and income
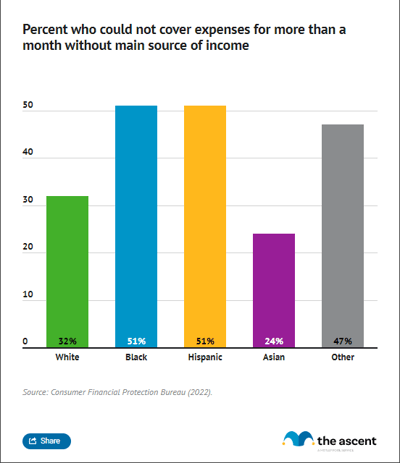
Black and Hispanic households face more financial instability compared to other groups -- 51% of those households could not cover more than a month of expenses if they were to lose their main income source and 52% had trouble paying bills in the 12 months leading up to February 2022.
Percent who could not cover expenses for more than a month without main source of income
| Race | Feb 2022 | June 2019 |
|---|---|---|
| White | 32% | 34% |
| Black | 51% | 53% |
| Hispanic | 51% | 50% |
| Asian | 24% | 24% |
| Other | 47% | 46% |
Percent with difficulty paying bills or expenses in the previous year
| Race | Feb 2022 | Feb 2021 | June 2019 |
|---|---|---|---|
| White | 30% | 30% | 35% |
| Black | 52% | 56% | 65% |
| Hispanic | 52% | 35% | 47% |
| Asian | 18% | 24% | 25% |
| Other | 46% | 52% | 42% |
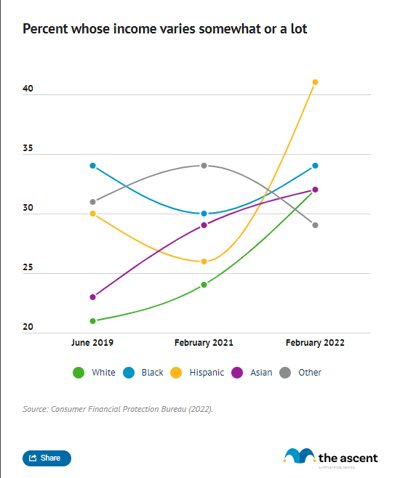
Fifteen percent more hispanic households also cope with income variability, more than any other group.
Percent whose income varies somewhat or a lot
| Race | Feb 2022 | Feb 2021 | June 2019 |
|---|---|---|---|
| White | 32% | 24% | 21% |
| Black | 34% | 30% | 34% |
| Hispanic | 41% | 26% | 30% |
| Asian | 32% | 29% | 23% |
| Other | 29% | 34% | 31% |
The ability to cover a month's worth of expenses with income, recent difficulty paying bills, and income variability generally track with education, age, and income, with more educated, older, and higher income households facing less financial insecurity.
FAQs
-
The CFPB has a short questionnaire that anyone can take to see their financial well-being score and how it compares to the national average. The survey does not require specific personal finance data and instead focuses on your general financial situation.
-
Here's what Charlie Pastor, CFP and contributing financial expert for Motley Fool Money recommends Americans do to boost their financial well-being:
"Young Americans might benefit from using a financial checklist to identify and order their priorities. The highest priority of most Americans, young savers included, should be to build an adequate emergency fund, which will allow their other savings to grow uninterrupted. Saving should be done in this order:- Contribute enough to your 401(k)/403(b) to get your full match.
- Fully fund your HSA and/or Roth IRA (if eligible) for the year.
- Fill up the remainder of your 401(k)/403(b).
- Fund a taxable brokerage account.
While few will make it to step four, this ordering will ensure that you maximize your savings. The most important step is to invest your savings -- the main advantage of starting young is maximizing your time in the market."
Pastor also recommends a high yield savings account, which "can offer Americans a way to compete with, if not beat, inflation while keeping their money in a safe, liquid account."
Sources
- Consumer Financial Protection Bureau (2022). "Making Ends Meet in 2022."
- Consumer Financial Protection Bureau (2020). "Insights from the Making Ends Meet Survey."
Our Research Expert
Jack Caporal is the Research Director for The Motley Fool and Motley Fool Money and has worked full-time for the company since 2021. Jack leads efforts to identify and analyze trends shaping investing and personal financial decisions across the United States. His research has appeared in thousands of media outlets including Harvard Business Review, The New York Times, Bloomberg, and CNBC, and has been cited in congressional testimony. He previously covered business and economic trends as a reporter and policy analyst in Washington, D.C. He serves as Chair of the Trade Policy Committee at the World Trade Center in Denver, Colorado. He holds a B.A. degree in International Relations with a concentration in International Economics from Michigan State University.
Motley Fool Stock Disclosures
Jack Caporal has no position in any of the stocks mentioned. The Motley Fool has no position in any of the stocks mentioned. The Motley Fool has a disclosure policy.