Average American Household Debt in 2025: Facts and Figures
KEY POINTS
- Record household debt: American households owe $18.8 trillion, with mortgage debt comprising 70% of the total.
- Credit card debt insights: The average revolving credit card balance is $6,523, with a delinquency rate of 8.69%.
- Debt payment-to-income ratio: Americans spend about 11% of their income on debt payments, a lower ratio than in most of the 2000s.
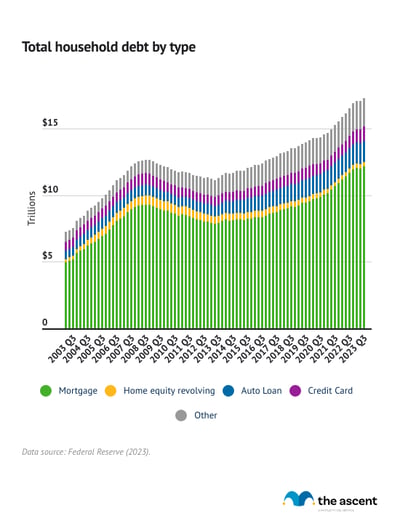
American households carry a total of $18.8 trillion of debt and average $105,056 per household. Total debt is at an all-time high as of the fourth quarter of 2025, according to the Federal Reserve. Mortgage debt makes up 70% of total household debt in the United States.
Drawing on data from Experian, the Federal Reserve, TransUnion, and the U.S. Census Bureau, Motley Fool Money breaks down the most common types of debt, including mortgages, auto loans, credit cards, and personal loans.
Key household debt statistics
| Figure | Amount |
|---|---|
| Total household debt, Q4 2025 | $18.775 trillion |
| Average household debt, 2024 | $105,056 |
| Total credit card debt, Q4 2025 | $1.277 trillion |
| Average credit card debt, Q3 2025 | $6,523 |
| Total mortgage debt, Q4 2025 | $13.17 trillion |
| Average mortgage debt, Q3 2025 | $268,060 |
| Median mortgage payment, December 2025 | $2,025 |
| Total home equity revolving debt, Q4 2025 | $433 billion |
| Average HELOC value, 2024 | $45,157 |
| Total auto loan debt, Q4 2025 | $1.667 trillion |
| Average auto loan debt, Q3 2025 | $24,602 |
| Average monthly new car payment, Q4 2025 | $748 |
| Average monthly used car payment, Q4 2025 | $532 |
| Average personal loan debt, Q3 2025 | $11,274 |
| Total student loan debt, Q4 2025 | $1.664 trillion |
| Other debt, Q4 2025 | $0.561 trillion |
Average consumer household debt in 2025
| Debt Type | Total, Q4 2025, unless otherwise specified |
|---|---|
| Total consumer debt (including types not listed below) | $18.775 trillion |
| Average household debt, 2024 | $105,056 |
| Total mortgage debt | $13.17 trillion |
| Total revolving home equity debt | $433 billion |
| Total auto loan debt | $1.667 trillion |
| Total credit card debt | $1.277 trillion |
| Total student loan debt | $1.664 trillion |
| Other debt | $0.561 trillion |
The New York Fed's quarterly Household Debt and Credit Survey (HHDC) shows that total consumer debt stands at $18.8 trillion as of the fourth quarter of 2025. That's a record high.
According to Experian, the average total consumer household debt in 2024 is $105,056. That's up 13% from 2020, when average total consumer debt was $92,727.
Average American debt payments in 2025: 11.3% of income
The Federal Reserve tracks the nation's household debt payments as a percentage of disposable income. The most recent debt payment-to-income ratio, from the third quarter of 2025, is 11.3%.
That means the average American spends about 11% of their monthly income on debt payments. Despite overall debt rising, Americans are still spending less of their income on debt than in most of the 2000s.
Average credit card debt in 2025
| Figure | Amount |
|---|---|
| Total credit card debt, Q4 2025 | $1.277 trillion |
| Average credit card debt, Q3 2025 | $6,523 |
| Delinquency rate of all credit card loans from commercial banks, Q3 2025 | 2.98% |
| Flow into early delinquency, Q4 2025 | 8.69% |
| Flow into serious delinquency, Q4 2025 | 7.13% |
According to the latest Household Debt and Credit survey results from the Fed, Americans owe a record $1.3 trillion in credit card debt.
Average revolving credit card balance: $6,523
A revolving credit card balance is one that persists between payments -- in other words, it's what people pay interest on. It's one of the most important figures when looking at credit card debt.
The average credit card balance was $6,523 as of the third quarter of 2025, according to TransUnion. That's up from $6,380 a year ago.
Based on data from the second quarter of 2024, Gen X has the highest average credit card balance, $9,255, while Gen Z has the lowest, $3,266.
Credit card balance by generation
| Generation | 2023 | 2024 | 2025 |
|---|---|---|---|
| Generation Z (18-25) | $3,148 | $3,266 | $3,493 |
| Millennials (26-41) | $6,274 | $6,642 | $6,961 |
| Generation X (42-57) | $8,870 | $9,255 | $9,600 |
| Baby boomers (58-76) | $6,601 | $6,648 | $6,795 |
| Silent generation (77+) | $3,434 | $3,375 | $3,445 |
Credit card delinquency rate: 8.7%
In the fourth quarter of 2025, 8.69% of credit card balances had become delinquent by 30 days or more over the past year. That's down from 8.88% last quarter and 8.96% a year ago.
Average mortgage and HELOC debt in 2025
| Figure | Amount |
|---|---|
| Total mortgage debt, Q4 2025 | $13.17 trillion |
| Average mortgage debt, Q3 2025 | $268,060 |
| Median mortgage payment, December 2025 | $2,025 |
| Average mortgage rate, Q4 2025 (30-year fixed) | 6.23% |
| Total home equity revolving debt, Q4 2025 | $433 billion |
| Average HELOC value, 2024 | $45,157 |
Mortgages make up 70% of American consumer debt. That number has risen consistently since mid-2013 and has recently accelerated as home prices hit record levels. Total mortgage debt stands at $13.2 trillion.
How much mortgage debt does the average American have? The average mortgage debt among Americans is $268,060, per TransUnion. That's up from $260,900 a year ago.
Average mortgage rate in 2025: 6.23%
The average 30-year fixed mortgage rate for the fourth quarter of 2025 is 6.23%, down from 6.57% in the third quarter.
Mortgage rates rose through 2023 after hitting lows in 2020 and 2021. They started to decline in the second half of 2024.
Median mortgage payment: $2,172
The median mortgage payment in December 2025 was $2,025, according to the Mortgage Brokers Association. The median mortgage payment has fallen slightly in the second half of 2025 as mortgage rates have decreased.
Average HELOC amount: $45,157
Based on data from Experian, the average value of a home equity line of credit in 2024 was $45,157.
Average auto loan debt in 2025
| Figure | Amount |
|---|---|
| Total auto loan debt, Q4 2025 | $1.667 trillion |
| Average auto loan debt, Q3 2025 | $24,602 |
| Average monthly new car payment, Q4 2025 | $748 |
| Average monthly used car payment, Q4 2025 | $532 |
Auto loan debt slightly increased to $1.67 trillion in the fourth quarter of 2025 from $1.66 trillion in the previous quarter.
The average auto loan debt is $24,602 as of the third quarter of 2025.
The average car payment for both new and used vehicles has stabilized over the course of the year, with little change in recent quarters, according to Experian data.
Average new car payment: $748
The average monthly payment on a new-car loan was $748 in the fourth quarter of 2025, according to Experian. Monthly payments on loans for new cars, by credit score, are as follows:
- Deep subprime (300-500): $748
- Subprime (501-600): $780
- Nonprime (601-660): $793
- Prime (661-780): $754
- Super prime (781-850): $727
- All: $748
Average used car payment: $532
The average monthly payment on a loan for a used car was $532 in the fourth quarter of 2025, according to Experian. Monthly payments on loans for used cars, by credit score, are as follows:
- Deep subprime (300-500): $556
- Subprime (501-600): $555
- Nonprime (601-660): $543
- Prime (661-780): $519
- Super prime (781-850): $527
- All: $532
Auto loans in delinquency in 2025: 1.45%
According to TransUnion, 1.45% of auto loans were 60 days or more past due in the third quarter of 2025, up from 1.44% a year ago.
Rising vehicle prices and overall inflation through 2022 and the start of 2023 may be responsible for a higher percentage of auto loans being in hardship compared to previous years.
Average personal loan debt in 2025: $11,274
| Figure | Amount | Prior Year |
|---|---|---|
| Average personal loan debt, Q3 2025 | $11,274 | $11,652 |
| Average unsecured personal loan balance, Q3 2025 | $8,457 | $8,514 |
| Average finance rate on 24-month personal loans from commercial banks, November 2025 | 11.65% | 12.32% |
| Personal loans in hardship, 60-days plus past due, Q3 2025 | 3.52% | 3.50% |
Personal loans are versatile financial products. They can be used for a variety of financial needs, including weddings, home renovations, vacations, or debt consolidation.
According to TransUnion, the average unsecured personal loan amount in the third quarter of 2025 was $8,457, down from $8,514 in the previous year.
The average personal loan debt per consumer is $11,274, indicating that many people with one unsecured personal loan have at least one more or are accruing interest faster than they can pay it off. That's lower than the level recorded a year prior, which was $11,652.
Average personal loan interest rate in 2025: 11.6%
In November 2025, the average interest rate for a 24-month personal loan was 11.6%, more than half a percentage point down from the previous year, according to the Federal Reserve.
Personal loans in delinquency in 2025: 3.52%
In the third quarter of 2025, 3.52% of unsecured personal loans were delinquent and in hardship, 60 days or more past due. That's slightly up from the same quarter in 2024, when 3.5% of unsecured personal loans were in hardship.
American medical debt
Medical debt can be difficult to track. However, it's clear that it's a growing problem.
According to The Urban Institute, 13% of Americans -- over 43 million people -- had medical debt in collections in 2022. That number is higher in communities of color, at 15%.
Some states have significantly higher numbers, too. For example, 24% of West Virginians have medical debt in collections.
The median debt also varies quite a bit. In the United States overall, the median medical debt in collections is $703. In Wyoming, Utah, Wisconsin, and Florida, that number is over $900.
While statistics are scarce, it seems likely that rising healthcare costs -- especially during a global pandemic -- have pushed these numbers higher in recent years.
Bankruptcy, delinquencies, charge-offs, and foreclosures
When Americans can't handle their debts, we see foreclosures, bankruptcies, delinquencies, and charge-offs. When those numbers go up, it's clear that Americans' personal finances are in trouble.
So what happened this year?
Personal bankruptcy statistics
According to the American Bankruptcy Institute's most recent release, there were 89,224 bankruptcy filings in the United States by the end of March 2022.
Interestingly, that's 17% less than the number we saw at the same point in 2021.
Personal bankruptcies by state
Here are the 2022 bankruptcy filings through March, per capita, for all 50 states and D.C. The total number of year-to-date (YTD) personal bankruptcy filings per capita nationwide is 1.38.
Charge-off and delinquency rates on consumer loans in 2025: 2.72%
The Federal Reserve Board collects statistics on charge-offs and delinquencies by loan type. Here's how they've changed since 2010:
Charge-offs and delinquencies for consumer loans decreased in the third quarter of 2025 compared to the previous quarter. Charge-offs and delinquencies for credit cards fell slightly.
The delinquency and charge-off rate for consumer loans (which includes credit cards) was 2.72%, while the overall rate, which includes real estate and commercial loans, was 1.49%.
Foreclosures in 2025
There were 367,460 foreclosures in 2025, according to ATTOM. That's up 14% from 2024.
Paying off debt
It may seem like Americans are swimming in too much debt to get out, but there are ways to pay off debt.
The first step toward paying off debt is understanding the total amount of debt you have. From there, you can determine what type of debt you hold, like credit card debt, a mortgage, or an auto loan. Then it is important to note how much you owe, the interest rate, and the minimum payment amount for each type of debt you owe.
With that information, you should be able to figure out how you can fit paying off debt into your personal budget. Our debt snowball calculator can help you organize your debts and explore repayment options.
Debt payoff apps can help you keep track of all those numbers, plus offer useful budgeting features like debt calculators and expense tracking.
-
Sources
- American Bankruptcy Institute (2022). "Bankruptcy Statistics."
- ATTOM (2026). "U.S. Foreclosure Activity Increases in 2025."
- Braga, Breno, Signe-Mary McKernan, and Caleb Quakenbush (2022). Urban Institute "Debt in America: An Interactive Map."
- Debt.org (n.d.). "Medical Debt Relief."
- Experian (2024). "Experian Study: Average U.S. Consumer Debt and Statistics."
- Experian (2025). "Experian 2024 Consumer Credit Review."
- Experian (2024). "Experian State of Automotive Finance Market Q4 2024."
- Experian (2024). "State of Retail Cards and Buy Now, Pay Later in 2024."
- Federal Reserve (2026). "Household Debt and Credit."
- Federal Reserve (2026). "30-Year Fixed Rate Mortgage Average in the United States."
- Federal Reserve (2026). "Delinquency Rate on Credit Card Loans, All Commercial Banks."
- Federal Reserve (2026). "Finance Rate on Personal Loans at Commercial Banks, 24 Month Loan."
- Federal Reserve (2026). "Household Debt Service Payments as a Percent of Disposable Personal Income."
- Federal Reserve (2026). "Charge-Off and Delinquency Rates on Loans and Leases at Commercial Banks."
- Mortgage Bankers Association (2026). "Mortgage Application Payments Decreased in December."
- TransUnion (2026). "Credit Industry Snapshot."
- TransUnion (2025). "TransUnion Report Reveals Diverging Credit Risk Trends Among U.S. Consumers."
Our Research Expert
Jack Caporal is the Research Director for The Motley Fool and Motley Fool Money and has worked full-time for the company since 2021. Jack leads efforts to identify and analyze trends shaping investing and personal financial decisions across the United States. His research has appeared in thousands of media outlets including Harvard Business Review, The New York Times, Bloomberg, and CNBC, and has been cited in congressional testimony. He previously covered business and economic trends as a reporter and policy analyst in Washington, D.C. He serves as Chair of the Trade Policy Committee at the World Trade Center in Denver, Colorado. He holds a B.A. degree in International Relations with a concentration in International Economics from Michigan State University.
Motley Fool Stock Disclosures
The Motley Fool has a disclosure policy.