Identity Theft and Credit Card Fraud Statistics for 2025
KEY POINTS
- Identity theft rises in 2025: 1,157,317 cases of identity theft were reported through the third quarter of 2025, more than all reported cases in 2024.
- Credit card fraud remains the top concern: Credit card fraud was the most common type of identity theft reported over that period.
- Identity theft by age: Americans aged 30 to 39 are most likely to fall victim to identity theft. Older and younger Americans are the least likely.
The latest identity theft and credit card fraud statistics paint a bleak picture. There were nearly 1.2 million reported cases of identity theft and over 500,000 cases of credit card fraud in the first three quarters of 2025. Both measures exceeded the number of cases reported over the entirety of 2024. Identity theft and credit card fraud have been the most common types of fraud since 2020, according to data from the Federal Trade Commission (FTC)
Read on for a full report covering identity theft statistics, how these crimes have evolved, the demographics at the biggest risk, and much more.
Identity theft in the United States
1,157,317 cases of identity theft were reported to the FTC in the first three quarters of 2025, exceeding the number of cases reported in all of 2024, putting 2025 on pace to be a record-breaking year for identity theft.
The identity theft statistics collected by the FTC are based on reports from consumers, so it's likely that there are many cases of identity fraud that go unreported.
Identity theft reports in the United States
| Year | Identity Theft Reports |
|---|---|
| 2019 | 650,000 |
| 2020 | 1,388,532 |
| 2021 | 1,434,477 |
| 2022 | 1,107,004 |
| 2023 | 1,036,855 |
| 2024 | 1,135,291 |
| 2025 Q1-Q3 | 1,157,317 |
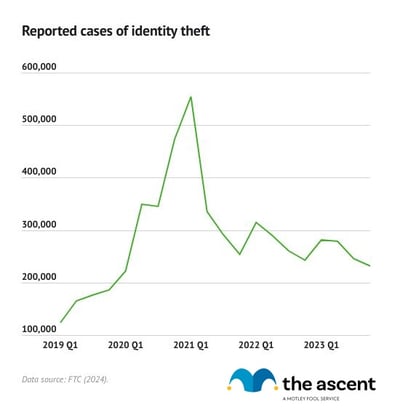
The rate of identity theft increased significantly from 2017 to 2021, growing from 371,000 reports to 1.4 million. While reports of identity theft have decreased after peaking in 2021, they remain significantly higher than pre-pandemic rates.
According to a report by Javelin Strategy & Research, identity theft cases resulted in losses of $23 billion in 2023, up from $20 billion in 2022.
The most common types of identity theft
Identity theft comes in many forms, but credit card fraud is the most common. 503,450 cases of credit card fraud were reported to the FTC in the first three quarters of 2025, nearly 180,000 more than were reported over the same period in 2024.
Every major type of identity theft increased in prevalence during the first three quarters of 2025 compared to the same period in 2024.
| Type of Identity Fraud | Reported Cases, 2025 Q1-Q3 | Year-Over-Year Percent Change |
|---|---|---|
| Credit card fraud | 503,450 | 54% |
| Other identity theft | 379,898 | 47% |
| Loan or lease fraud | 178,210 | 37% |
| Bank fraud | 96,522 | 12% |
| Employment or tax-related fraud | 74,171 | 1% |
| Phone or utilities fraud | 67,675 | 8% |
| Government documents or benefits fraud | 57,360 | 5% |
Other identity theft, which includes schemes involving email and social media, insurance, medical services, online shopping, investing accounts, and more, was the second-most commonly reported type of fraud through the third quarter of 2025. Identity theft tied to online shopping was the fastest-growing category within the other identity theft group.
There was a significant increase in identity theft related to student loans year over year, as scammers took advantage of payments on federal loans resuming. Year over year, federal student loan identity theft increased by 195%, and non-federal student loan identity theft rose by 74%.
Credit card fraud in the United States
Credit card fraud was the most common type of identity theft through the third quarter of 2025, with 503,450 reported cases, representing a 54% year-over-year increase.
Credit card fraud has been on a steady rise in recent years. There were around 33,000 more reported cases of credit card fraud in 2024 than in 2023 and more than 180,000 more cases than reported in 2019.
Credit card fraud reports by year
| Year | Credit Card Fraud Reports |
|---|---|
| 2019 | 277,739 |
| 2020 | 399,727 |
| 2021 | 395,391 |
| 2022 | 448,443 |
| 2023 | 425,988 |
| 2024 | 458,571 |
| 2025 Q1-Q3 | 503,450 |
From 2017 through 2019, credit card fraud was the most common type of identity theft, only to be overtaken by government documents and benefits fraud in 2020 and 2021 when scammers took advantage of pandemic-era government benefit programs.
Still, there was a 49% increase in reported credit card fraud cases in 2020 compared to 2019. In 2023, there were 53% more reported cases of credit card fraud than in 2019.
Types of credit card fraud
There are two types of credit card fraud:
- New account: An identity thief uses your information to open a credit card account in your name.
- Existing account: An identity thief uses a credit card that you opened. This is usually done by stealing the credit card information.
New account fraud accounts for 90% of all credit card fraud, although existing account fraud is also on the rise.
| Year | Existing Account Fraud | New Account Fraud |
|---|---|---|
| 2019 | 31,044 | 246,695 |
| 2020 | 33,992 | 365,735 |
| 2021 | 32,286 | 363,105 |
| 2022 | 39,414 | 409,029 |
| 2023 | 44,878 | 381,110 |
| 2024 | 52,432 | 406,139 |
| 2025 Q1-Q3 | 46,859 | 465,247 |
When considering how to avoid credit card fraud, preventing people from acquiring card information probably comes to mind. But the statistics show that it's actually far more likely for someone to open an entirely new account using stolen personal data than for fraud to occur via a stolen credit card.
Why is new account fraud the dominant type of credit card fraud? There are several explanations:
- Existing account fraud has become more difficult. Due to credit card chip technology, the transaction process is more secure, making it harder for criminals to counterfeit credit cards.
- Data breaches have exposed information for hundreds of millions of people. Identity thieves can use this information for new account fraud.
- It's easier to steal money through new account fraud because it involves an entirely new account that the consumer is unaware of. With an existing account, the card issuer or the consumer may notice suspicious activity and lock the card in the event of an account takeover by identity thieves.
It's essential to note that individuals can dispute credit card charges with their credit card issuer if a card or account information has been stolen. Creditors can then help remove fraudulent charges, which could negatively impact credit reports in the future.
Fraud detection and prevention, plus other consumer protections, are huge advantages of using a credit card, in addition to the opportunity to increase your credit score. Motley Fool Money has a guide for how to apply for a credit card and get approved.
The growth of synthetic account fraud
Identity thieves are always developing new ways to steal money. A relatively new form of identity theft, called synthetic account fraud, is one of the fastest-growing financial crimes in the nation.
Synthetic fraud attempts have grown 184% from 2019 and 21% from 2022 to 2023, according to TransUnion. Synthetic identity fraud was up 153% from the second half of 2023 to the first half of 2024, the credit bureau found.
Synthetic account fraud involves a combination of real and fabricated information, such as a real Social Security number and a false name. The synthetic identity can be used to apply for credit cards, loans, and government benefits. Perpetrators often spend time building a good credit score with synthetic identities. Then, they max out an identity's credit and abandon its accounts.
The video game and communities industries are the most common targets for synthetic fraud, according to analysis from TransUnion. In the first half of 2024, 11.5% of online communities-related transactions (online dating and other online forums) and 11.4% of video game transactions were suspected to be fraudulent or attempts at fraud. In terms of volume, attempted communities fraud was up 22.3% and fraud via video games was down 6%
| Digital Fraud Attempts by Industry | Suspected Fraud Attempt Rate, H1 2024 | Percent Change in Volume, Year Over Year | Top Fraud Type |
|---|---|---|---|
| Retail | 7.3% | (61.1%) | Promotion abuse |
| Video games | 11.4% | (6.3%) | Scammer/solicitation |
| Telecommunications | 2.4% | (89.2%) | Identity theft |
| Gaming (online gambling) | 7.2% | (9.2%) | Promotion abuse |
| Financial services | 4.6% | (3.6%) | Account takeover |
| Communities (online dating, forums, etc.) | 11.5% | 22.3% | Profile misrepresentation |
| Travel and leisure | 1.0% | (33.2%) | Credit card fraud |
| Insurance | 1.8% | (32.4%) | Ghost broker |
| Logistics | 2.9% | 120.7% | Shipping fraud |
Among lenders, auto lenders are most exposed to synthetic fraud, with losses in the first half of 2024 totaling $2 billion. That's double that of bank credit cards and over 10 times more than retail credit cards and unsecured personal loans.
| Lender Industry | H1 2024 | 2023 |
|---|---|---|
| Auto loans | $2 billion | $1.9 billion |
| Bank credit cards | $1 billion | $1 billion |
| Retail credit cards | $121 million | $138 million |
| Unsecured personal loans | $52 million | $55 million |
Fraudsters target the auto industry because they view it as most profitable, according to Shai Cohen, the senior vice president and head of global fraud solutions at TransUnion. Using a synthetic identity, fraudsters can secure an auto loan for an expensive car, leaving an innocent victim and auto company on the hook.
Identity theft reports by age
| Age | Identity Theft Reports Q1-Q3 2025 | Percent of Total Reports |
|---|---|---|
| 19 and Under | 21,615 | 2% |
| 20 to 29 | 227,079 | 20% |
| 30 to 39 | 376,286 | 32% |
| 40 to 49 | 257,498 | 22% |
| 50 to 59 | 151,750 | 13% |
| 60 to 69 | 81,558 | 7% |
| 70 to 79 | 33,671 | 3% |
| 80 and over | 9,283 | 1% |
Those in the 30- to 39-year-old age range have reported the most identity theft incidents for years.
The youngest and oldest Americans report the fewest cases of identity theft. That doesn't necessarily mean they are less susceptible to identity theft. Instead, it may suggest that they simply opt not to report, are unaware that they can, or are unsure how.
Here's a look at the most common types of identity fraud for each age group:
| Age | Most Common Type of Identity Theft | Number of Reports, Q1-Q3 2025 | Percentage of Age's Total Identity Theft Reports |
|---|---|---|---|
| 19 and under | Employment or tax-related fraud | 10,213 | 47% |
| 20 to 29 | Credit card fraud | 92,716 | 41% |
| 30 to 39 | Credit card fraud | 153,119 | 41% |
| 40 to 49 | Credit card fraud | 99,824 | 39% |
| 50 to 59 | Credit card fraud | 55,841 | 37% |
| 60 to 69 | Credit card fraud | 26,464 | 32% |
| 70 to 79 | Credit card fraud | 10,278 | 31% |
| 80 and over | Credit card fraud | 2,653 | 29% |
Identity theft by state
Here are the states with the most identity theft reports recorded in through the third quarter of 2025:
- Florida: 135,317
- California: 135,575
- Texas: 128,758
- Georgia: 63,264
- New York: 59,017
Population sizes play a large role in which states have the most identity theft reports. Looking at each state's number of reports per 100,000 residents provides a clearer picture of where identity theft is more prevalent.
States ranked by identity theft reports per capita
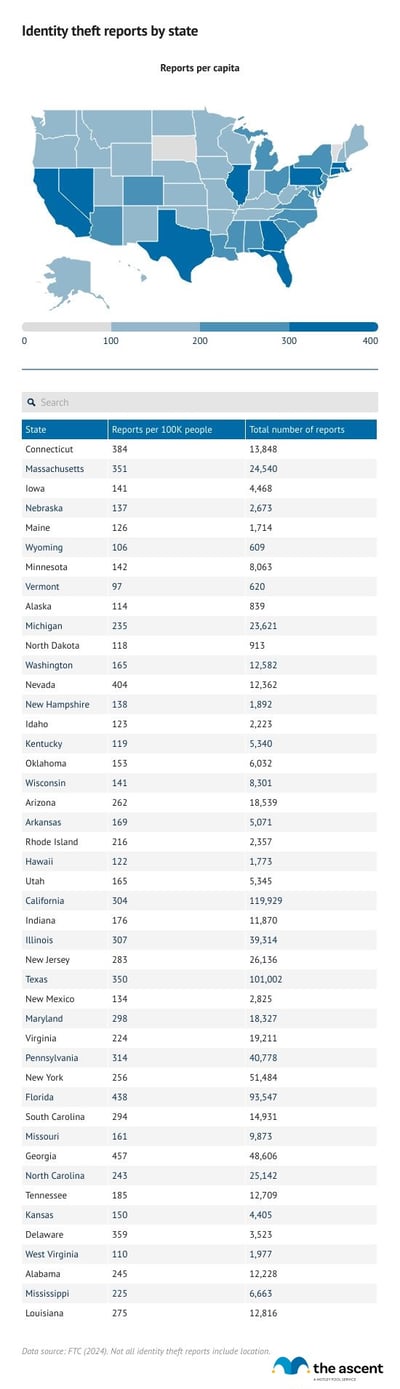
Identity theft per capita declined in just one state, Massachusetts, when comparing the first three quarters of 2025 to the same period in 2024.
The states that saw the largest percent increase in identity theft reports per 100,000 population were:
- Mississippi: +80%
- Washington, D.C.: +64%
- Illinois: +63%
- Louisiana: +62%
- Florida: +61%
Not all identity theft reports filed with the FTC contain location information.
Top metropolitan areas for identity theft
The greater Miami metropolitan area and Atlanta metro posted the highest reported cases of identity theft per capita through the third quarter of 2025.
Data breaches
Data breaches are one of the primary methods by which criminals commit identity theft and credit card fraud. The hackers who steal information through data breaches often sell it on the dark web. Buyers then use the information for various types of fraud.
According to Nationwide, 58% of consumers are concerned about being a victim of cybercrime, but 69% don't have cyber insurance.
Cyber insurance can help limit costs stemming from cybercrime and reduce the time it takes to recover from cyberattacks.
The most cited reasons for consumers not to have cyber insurance are a lack of knowledge about cyber insurance, not knowing cyber insurance is available to them, and thinking that coverage is too expensive, according to Nationwide.
Obtaining cyber insurance may be wise. Sixty-nine percent of consumers don't feel prepared to recover from a cyberattack, and 68% haven't thought about how they would respond, according to Nationwide.
Data breaches by year
The number of data compromises fell in 2024 by about 50, to 3,158, but the number of individuals impacted grew by roughly 1 billion, to 1.35 billion -- a staggering number. 560 million people had their payment and personal information exposed when Ticketmaster fell victim to a cyberattack in May 2024. The scale of the attack alone surpassed the total number of people impacted by data breaches in each of the years from 2019 to 2023.
| Year | Number of Data Compromises | Number of Individuals Impacted |
|---|---|---|
| 2016 | 1,104 | 2,541,581,891 |
| 2017 | 1,631 | 2,081,515,330 |
| 2018 | 1,280 | 2,231,245,353 |
| 2019 | 1,362 | 887,286,658 |
| 2020 | 1,108 | 300,562,519 |
| 2021 | 1,860 | 300,607,163 |
| 2022 | 1,801 | 422,212,090 |
| 2023 | 3,205 | 352,027,892 |
| 2024 | 3,158 | 1,350,835,988 |
Until 2024, a trend of more data breaches but fewer individuals being impacted had taken shape. The Identity Theft Resource Center reports that cybercriminals aim to acquire specific personal information that can be used for identity theft, fraud, and scams instead of more sprawling attacks.
Most data breaches occur via cyberattack, with phishing, ransomware, and malware being the most common tactics. Here's how each works:
- Phishing occurs when a cybercriminal impersonates a trusted entity, prompting the target to click a link in an email, text message, or chat message.
- Ransomware is a type of malware that threatens to release sensitive data if the target doesn't pay a ransom.
- Other types of malware -- which can be inadvertently downloaded through fraudulent ads or other links -- can monitor computer activity and keystrokes, and steal personal information.
Causes of data breaches
| Breach Type | 2020 | 2021 | 2022 | 2023 | 2024 |
|---|---|---|---|---|---|
| Cyberattacks | 876 | 1,610 | 1,581 | 2,364 | 2,525 |
| Human and system errors | 153 | 179 | 163 | 730 | 310 |
| Physical attacks | 78 | 51 | 46 | 53 | 33 |
| Supply chain attacks | - | - | - | 242 | - |
| Unknown | - | 12 | 8 | 53 | 288 |
| Total | 1,107 | 1,852 | 1,798 | 3,389 | 3,158 |
There were three main root causes of the over 3,000 data breaches in 2024:
- Cyberattacks: Includes phishing, ransomware, malware, and unsecured cloud environments.
- Human and system errors: Includes failure to configure cloud security, email or letter correspondence, and lost devices and documents.
- Physical attacks: Includes device theft, document theft, improper disposal, and skimming devices.
Cyberattacks are by far the most common cause of data breaches, affecting the largest number of people overall. Human and system errors occur less frequently, but when they do, they affect a larger number of people on average. A cyberattack in 2021 impacted an average of 117,000 people, whereas each human and system error impacted about 586,000 people.
Types of data compromised
| Type of Data Compromised | Number of Breaches, 2021 | 2022 | 2023 | 2024 |
|---|---|---|---|---|
| Name | 1,620 | 1,613 | 2,599 | 2,718 |
| Full Social Security number | 1,146 | 1,216 | 1,706 | 18,17 |
| Date of birth | 688 | 660 | 847 | 911 |
| Current home address | 688 | 588 | 806 | 806 |
| Medical history/condition/treatment/diagnosis | 464 | 465 | 701 | 812 |
| Driver's license/State ID number | 456 | 557 | 717 | 857 |
| Bank account number | 410 | 501 | 811 | 890 |
| Medical insurance account number | 365 | 390 | 413 | 531 |
| Phone number | 220 | 169 | 293 | 250 |
| Payment card full number | 212 | 211 | 600 | 671 |
| Undisclosed records | 190 | 169 | 583 | 423 |
| Medical provider account/record number | 198 | 193 | 211 | 258 |
In 2024, dozens of different types of data were compromised in data breaches. The table above includes the numbers for the types of data that are often used for identity theft.
Most data breaches included people's names, and over half of them included full Social Security numbers.
Identity theft and credit card fraud pick up steam in 2025
There were roughly 196,000 more cases of identity theft reported in the first half of 2025 compared to the same period in 2024, and cases remain significantly higher than pre-pandemic.
2025 is on track to be a record year for identity theft and credit card fraud. There have been more reports of every major type of identity theft in the first half of the year than in the first half of 2024.
Data breaches in 2024 were just off the record high set in 2023, but impacted almost a million more people due to a series of massive cyberattacks.
While identity theft isn't as commonplace as it was during the height of the pandemic in late 2020 and early 2021, reports still remain above what was recorded in 2019.
To prevent identity theft, the FTC recommends securing personal information, whether in physical or online form, and being vigilant when someone requests your Social Security number or other sensitive personal information.
-
Sources
- AARP (2024). "Identity Fraud Cost Americans $43 Billion in 2023."
- Federal Trade Commission (2025). "Identity Theft Reports."
- Identity Theft Resource Center (2025). "2024 Annual Data Breach Report."
- Nationwide (2022). "Despite rising concern, Americans leave themselves vulnerable to cyberattacks."
- TransUnion (2024). "2024 State of Omnichannel Fraud."
Our Research Expert
Jack Caporal is the Research Director for The Motley Fool and Motley Fool Money and has worked full-time for the company since 2021. Jack leads efforts to identify and analyze trends shaping investing and personal financial decisions across the United States. His research has appeared in thousands of media outlets including Harvard Business Review, The New York Times, Bloomberg, and CNBC, and has been cited in congressional testimony. He previously covered business and economic trends as a reporter and policy analyst in Washington, D.C. He serves as Chair of the Trade Policy Committee at the World Trade Center in Denver, Colorado. He holds a B.A. degree in International Relations with a concentration in International Economics from Michigan State University.
Motley Fool Stock Disclosures
The Motley Fool has a disclosure policy.