Updated
Understanding the optimal inventory turnover ratio for your company and products is like a lighthouse, directing you to make the best business decisions.
Inventory management is a critical business operation that directly impacts sales efforts, cost control, and financial projections. Too much inventory results in bloated expenses and resources that could be better spent.
And too little inventory can turn off customers since there’s no product to fulfill orders, stunting sales and jeopardizing the business life cycle.

Balancing inventory on hand with expected sales is a critical success indicator. Image source: Author
Inventory turnover ratio is a precise measure of the health of inventory management practices. It quantifies the balance between average inventory on hand and sales success. It’s a critical performance measure that should be in your business metrics tool kit.
Continue reading to learn more about inventory turnover and other critical accounting ratios, see how to find inventory turnover and recognize the beneficial insights these measures provide your business.
Overview: What is inventory turnover?
Inventory turnover is a measurement of how inventory has sold during a given time period. Along with accounting terms like net profit margin and contribution margin, your inventory turnover ratio measures the efficiency of your business.
You can deconstruct your inventory turnover into two key components:
- Stock purchasing: Businesses must accurately forecast the amount of inventory needed during a given period of time. For most companies, stock purchasing must be a dynamic process. Busier seasons require inflated inventory while slower seasons should see a tightening of stocked inventory.
- Sales: Inventory forecasts and sales projections are different sides of the same coin. One directly influences the other, thus it’s critical that sales and inventory managers collaborate to achieve a profitable and efficient turnover rate. Something to consider here is whether you operate with revenue recognition principles or not, as this dictates when a sale becomes a sale and revenue can be reinvested in more inventory.
A high turnover typically indicates an efficient and profitable balance between sales and inventory turns. However, a high inventory turnover may indicate that stock buyers have a hard time keeping up with sales demand.
The high-growth phases of the product life cycle are susceptible to difficulties with supplying demand.
A lower turnover rate is often the result of stagnant sales or overloaded inventory reserves. Lower inventory turnover rates may indicate the need to adjust your sales mix to focus on lower-cost products until you recoup resources from inventory stockpiles.
How to calculate inventory turnover
The inventory turnover ratio formula is straightforward, but it requires accurate numbers to get it right. Most accounting software and even e-commerce platforms automate these calculations, but it’s good to understand what exactly they mean. Let’s take a look at how to calculate turnover over the course of a year.
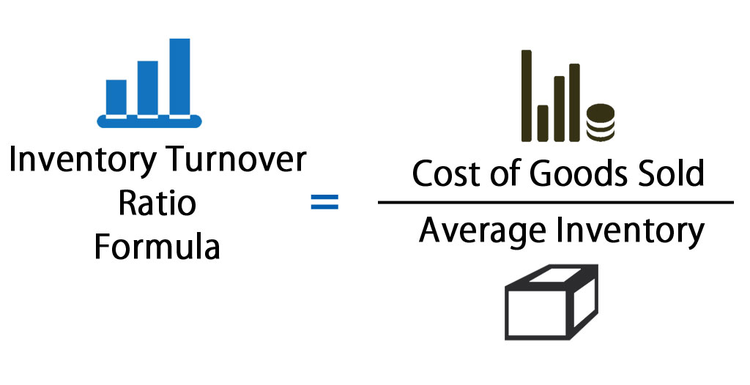
The inventory turnover formula is dependent on accurate COGS and inventory value calculations. Image source: Author
To calculate annual inventory turnover rate, start with your annual cost of goods sold (COGS). This number is the calculation of all your costs associated with selling your company’s product. Once you have your COGS, you divide it by your average annual inventory value to get your inventory turnover ratio.
For example, a company has an annual $100,000 in COGS and its average annual inventory value is $20,000. The inventory turnover ratio is five, meaning that the business turned over its inventory five times during this year.
Most of the best accounting software options automate findings with an inventory turnover calculator, providing easily digestible reports and dashboards.
Example of inventory turnover
Let’s take a look at a real-world example of inventory turnover and what it says about business.

Inventory is all about balance as too much and too little can each be detrimental. Image source: Author
Annual sales for Walmart Stores in 2019 were $514 billion. The value of their inventory at year-end was $44 billion, and their annual COGS was $385 billion. Here’s how the inventory turnover ratio formula breaks this down:
Walmart’s inventory turnover = $385 billion (COGS) / $44 billion (inventory value)
Walmart’s inventory turnover = 8.75
To better understand what this 8.75 means exactly, you need to understand days sales of inventory.
Days sales of inventory (DSI) is a measure of how many days it takes to sell inventory. You calculate it by dividing your time period by your corresponding inventory turnover ratio. For example, if your business sold out of inventory each day for every day of the year, your DSI would be 365.
So in the context of Walmart, they turn over their inventory every 42 days (365 / 8.75). It’s important to realize that the DSI doesn’t necessarily correspond to a year. You could look semi-annually, about 182 days, or quarterly, about 91 days.
What’s critical is that your COGS and inventory value have a corresponding time period.
What does inventory turnover ratio tell you about your business?
Inventory turnover ratio indicates how healthy the intricate balance is between your inventory management and sales success. Here’s what that can tell you exactly about your business.
Consistent vs. dynamic sales measures
Monitoring changes in your inventory turnover ratio throughout the year as well as year over year highlights fluctuations in your sales. There are positives and negatives with consistent and dynamic sales. What’s important is realizing whether or not you can depend on consistent sales from year to year or throughout the year.
Sales consistency provides lessons you can infer about inventory needs. There can be comfort in this consistency, but it’s important to always keep an eye on your metrics as consistency is in constant flux.
Dynamic sales are a great trend because they typically point to spurts of sales growth. What’s critical for dynamic sales trends is spotting what’s driving the upward or downward movements and taking actions to prolong or overcome it.
Declining demand for your product
Another highly actionable trend you can learn from monitoring inventory turnover is the demand for your product in question.
You can be making all the right decisions with your inventory management, but those decisions are few and far between if there are no sales driving the need for additional inventory. Inventory turnover can pinpoint which products aren’t moving off your shelves.
Declining demand for your product isn’t always bad news. You hopefully have multiple products in your portfolio so you can pivot resources to other products, as you address the declining product.
Mismanaged stock levels
If your sales are booming but the business doesn’t seem to be responding, a common cause is overstocked inventory levels. Your inventory turnover ratio can help you understand and make the best decisions moving forward.
A low inventory turnover ratio indicates overstocked products and weak sales. On the other hand, a high inventory turnover ratio is often the result of strong sales and difficulty keeping up with inventory.
A high inventory turnover rate is always favorable, but a high rate may indicate an inability to source inventory to keep up with sales demand.
How to optimize inventory turnover
It bears repeating that optimizing your inventory turnover is all about striking a balance between sales and inventory management. Striking this balance will be different for every business, but there are a few actions you can take to ensure you’re set up for optimal success:
- Set goals to optimize how long you hold on to inventory for all products. It’s important to be intentional with your inventory management so that you can be more agile and eliminate costs associated with housing stagnant inventory.
- Understand and plan around the unique needs of your industry. The bar you set for your turnover ratio must be consistent with your industry and competitors. Optimal measures vary greatly from retail to industrial machinery, as an example.
- Balance your product portfolio to mitigate risks and downward trends. No products are safe from ever-changing consumer whims, but you can safeguard your business by building a strong product portfolio that features favorable turnover rates.
Strike a balance for sustained success
Inventory turnover ratio highlights how efficient a business is at turning cash and resources into products and services and converting those into profitable sales.
This activity ratio isn’t some single great metric for your business, but it can provide detailed insights into individual products so that you can make the best decisions to sustain future business growth. Make it a point to strike the necessary balance between sales and inventory.
Be sure to employ the best inventory management software for your business in addition to your chosen accounting and e-commerce software to add even more efficiency and organization to other aspects of your inventory process.
Our Small Business Expert
Experienced content leader empowering businesses of all sizes to employ the strategies and technologies needed to generate growth and sustain success. Always excited to analyze trends, conduct interviews, and dig into the data to build helpful content for readers across industries and disciplines. My work has been cited in notable publications like The New York Times, Forbes, CNN, and TIME Magazine. I’ve also been featured on numerous market/industry-specific blogs such as Groupon’s merchant blog and Yelp’s business center blog.
Share This Page
We're firm believers in the Golden Rule, which is why editorial opinions are ours alone and have not been previously reviewed, approved, or endorsed by included advertisers. The Ascent, a Motley Fool service, does not cover all offers on the market. The Ascent has a dedicated team of editors and analysts focused on personal finance, and they follow the same set of publishing standards and editorial integrity while maintaining professional separation from the analysts and editors on other Motley Fool brands.
The Motley Fool has a disclosure policy.