Published April 22, 2024
While some people like to learn through reading, I am more of a visual learner. While I need supplementary text to help clarify whatever it is that I am looking at, the visuals provide that additional context I look for to see a concept in practice. Otherwise, my ADHD imagination will get the better of me and creativity will run wild trying to understand the plain text that I’m looking at.
Don’t get me wrong, as a writer, I enjoy reading quite a lot. However, when it comes to project management or any other type of technical process, I use visual aids as a means to contextualize the assignments I’m working on.
That’s why when I manage a project, I prefer to use project management tools that offer a Gantt chart creator.
What is a Gantt chart?
There are lots of ways to track your tasks while using project management software. There are task lists, shared calendars, kanban boards, and in the instance of this guide, Gantt charts.
Gantt charts are more than just schedule charts. They’re a detailed visual representation of your project from start to finish. They’re a horizontal bar planning chart that helps contextualize all kinds of project details, such as:
- When tasks begin and end
- Who the tasks are assigned to
- Any task dependencies
- How long a task will take to complete
- Which tasks overlap with others
- The critical path for a project
These charts are created during the initiation stage when putting together a feasibility study, used during the planning stage when fine tuning your critical path, and are continuously updated during the rest of the project management process as needed. Typically you’ll include this chart in your statement of work when laying out your project schedule.
For the most part, all Gantt charts offered in project management tools will look relatively the same, with a few minor aesthetic differences. My favorite Gantt chart benefit is the context they provide about where your project stands far better than a standard task list.
Elements of a Gantt chart
There are specific elements that every project Gantt chart needs in order to fulfill that role. Just so you have some context of what I’m talking about, here’s a Gantt chart example I marked up from TeamGantt:

This example shows the different tasks listed on the left, where they fall on the schedule, and which tasks are dependent on each other. Image source: Author
Of course, not all Gantt chart software will look exactly like this one but will follow this formula for the most part. These are the five most crucial elements of a simple Gantt chart:
1. Tasklist
The tasklist is usually located on the left side of the Gantt chart and corresponds with its own task duration bar in the center of the screen.
Obviously, these are the deliverables you are working towards accomplishing throughout the execution phase of the project life cycle. Typically you can break this list down into separate teams or task type groups.
2. Date indicator
While the calendar dates run along the top of the chart, the date indicator, either represented as a vertical line or vertically highlighted segment of the chart, will show the current date and where exactly you should be in terms of task completion at that point.
3. Task duration bars
These are the meat of the Gantt chart and represent how long a task is scheduled out for completion. Most project management tools allow you to alter the duration by clicking and dragging these bars without having to enter each individual task to adjust the dates.
4. Task dependency arrows/lines
Not all project management software options allow for dependencies (although all of them should), but when they do, they are represented either as arrows or connecting lines that show which tasks must be completed before another begins.
5. Task owner indicator
Finally, every task in a Gantt chart ought to show who is responsible for it. If this isn’t readily apparent in the chart, clicking on a task will show who owns which task.
How to create a Gantt chart
The Gantt chart creation process will vary slightly from software to software, but for the most part, you’ll find the general idea to remain the same. The differences range from allowing you to create tasks while in the Gantt chart view instead of just in the main task list, while other differences go as far as button placement.
That being said, here is a general step-by-step process on how to make a Gantt chart.
Step 1: Enter project tasks into software
Most project management platforms will allow you to create project tasks both on the main task manager as well as from the Gantt chart view.
All you have to do is find the “add task” function which is typically located in the top right-hand corner of your software, then fill in the relevant details such as the task description, due date, and attach any relevant task documents. These tasks will then populate onto your Gantt chart.
Step 2: Assign tasks to the relevant team members
Once you’ve entered your tasks into your software, add the relevant team members to the tasks. Be sure to include yourself, or a team leader, on these tasks as the manager so you can track all progress made.
Step 3: Create task dependencies if necessary
Once you’ve added all of the relevant information and team members to your task, make sure you create any necessary task dependencies. These dependencies will show up on your Gantt chart as either connecting lines or arrows between the task duration bars.
Step 4: Label tasks based on the responsible teams
Use the color-coding capabilities of your project management software in order to separate tasks by their respective teams. This will make it easier to track their progress without confusing some tasks with others.
The best project management software for Gantt charts
While most of the software options I’ve reviewed offer some sort of Gantt functionality, there are three, in particular, that stand out to me with their exceptional timeline charts. These tools are more than just project scheduling software options, but their Gantt capabilities are what really put them ahead of the pack.
That being said, they also function as more than just glorified Gantt chart makers due to their long lists of project management features. Interestingly enough, all three of these platforms achieved an overall 8 out of 10 in my Ascent scoring, so they’re all fantastic choices to go with.
1. TeamGantt
As you probably guessed by the name of this software option, TeamGantt specializes in creating Gantt charts. They’re so good that I made them number one on this list and used them for the example above.
When it comes to aesthetics, their Gantt charts are very middle-of-the-road in terms of looks, but when it comes to functionality, they’re easily my favorite option. The simplicity of TeamGantt is obvious when you start out, thanks to the Gantt chart template options, which of course I took advantage of.
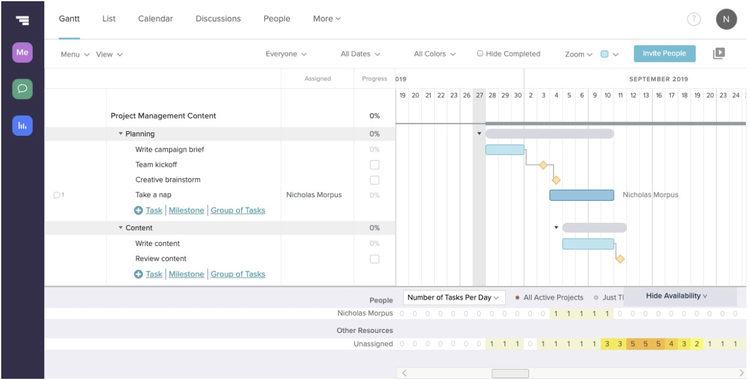
I love that TeamGantt even includes a workload management feature at the bottom of the chart for tracking the number of tasks I am working on. Image source: Author
I love that TeamGantt’s chart creation is extremely simple and all of the information you could possibly need is right there on the screen in front of you.
You don’t have to leave the chart to add additional tasks because the owners are shown right on the chart, and creating dependencies is as simple as clicking a dot at the end of a duration bar and dragging it to the appropriate task.
2. Mavenlink
If you’re looking for a more corporate project management software that offers Gantt chart functionality, Mavenlink offers pretty much anything you’d need and then some. The Gantt charts are easy to put together and use all of the basic elements I’ve laid out above.
When creating your charts in Mavenlink you even have the option to draw out the critical path of a project with the click of a few buttons.
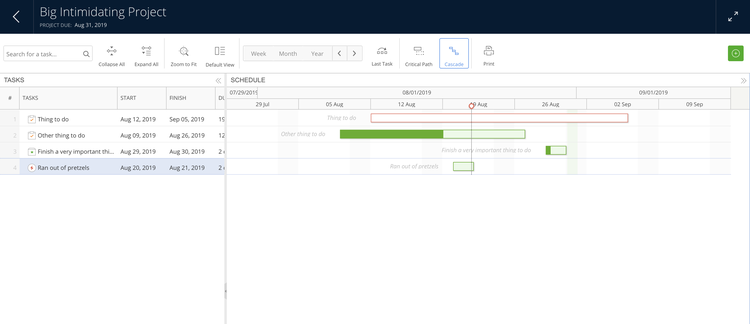
Mavenlink’s Gantt chart user interface is a little plain, but the navigation is exceptionally straightforward. Image source: Author
Additionally, you can create dependencies, add additional tasks, and manage all of those task details from the Gantt view. While corporate project management might be a large and intimidating process, Mavenlink will help you simplify your work with its simple navigation and a long list of features outside of Gantt charts.
3. Wrike
While TeamGantt is great for its Gantt functionality and Mavenlink is great for enterprise project management, Wrike is a fantastic option for all-around project management.
Yes, Wrike has Gantt charts and it offers every bit of functionality described above and more. Wrike’s Gantt charts can create task dependencies, find the critical path for your project, and drag and drop your duration bars wherever you see fit.
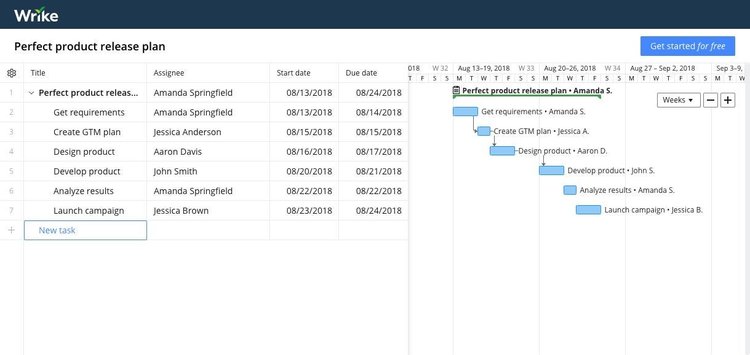
Wrike has an interesting layout for its Gantt charts that includes the task owner’s name on both the task list and chart. Image source: Author
I say Wrike is great for all-around project management because it can do much more than act as a Gantt chart generator, and it’ll do it for a cheaper price than Mavenlink. You can create task lists, kanban boards, standard task lists, manage budgets, create project reports, track your time, and so much more. Wrike is the jack-of-all trades when it comes to project management.
There’s so much more to learn about project management
Chances are if you’re learning about Gantt charts here for the first time, this means you’re new to project management. If that’s the case, then welcome to The Ascent.
We are the perfect go-to resource for everything related to project management, including software reviews and comparisons, other beginner's guides, how-to guides, project management principles, and project management best practices. Be sure to check out everything we have to offer to get you up to speed.
Our Small Business Expert
Nick is a seasoned writer and digital marketing specialist with lots of experience in B2B software research. He has always had a passion for technology and has worked as an Apple technical specialist, in the social media startup scene, and also in local DC real estate.
Share This Page
We're firm believers in the Golden Rule, which is why editorial opinions are ours alone and have not been previously reviewed, approved, or endorsed by included advertisers. The Ascent, a Motley Fool service, does not cover all offers on the market. The Ascent has a dedicated team of editors and analysts focused on personal finance, and they follow the same set of publishing standards and editorial integrity while maintaining professional separation from the analysts and editors on other Motley Fool brands.
The Motley Fool has a disclosure policy.