Average American Household Debt in 2020: Facts and Figures
By: Dann Albright | Published Nov. 18, 2020

Image source: Getty Images
How much debt does the average American household have? How is that debt split between mortgages, auto loans, credit cards, and other types of loans? What about the coronavirus pandemic and its effects on Americans' jobs and income?
The answers to questions like these can give us insight into the financial state of the average American household. We pulled together as much data as we could find on Americans' average household debt in 2020 to give you a snapshot of how we handled our debt this year.
Keep reading for more detailed statistics on each type of debt, including comparisons of debt over time and breakdowns by race, age, and more.
Key findings
Figure | Amount |
---|---|
Total household debt, Q3 2020 | $14.35 trillion |
Average (mean) household debt, Nov. 2020 | $145,000* |
Total credit card debt, Q3 2020 | $807 billion |
Average (mean) revolving credit card debt, 2019 | $6,271 |
Total mortgage debt, Q3 2020 | $9.86 trillion |
Average mortgage debt, Oct. 2020 | $215,655 |
Average (mean) mortgage payment, 2019 | $1,487 |
Total home equity revolving debt, Q3 2020 | $362 billion |
Average (mean) HELOC value, 2019 | $49,929 |
Total auto loan debt, Q3 2020 | $1.36 trillion |
Average (mean) auto loan debt, 2019 | $17,553 |
Average monthly new car payment, Q2 2020 | $568 |
Average monthly used car payment, Q2 2020 | $397 |
Average new unsecured personal loan amount, Sept. 2020 | $5,538 |
Editor's note: You may be wondering why there are some 2019 data points in our piece on household debt in 2020. This is because some surveys -- including the Federal Reserve Board's Survey of Consumer Finances, which is carried out every three years -- release data the year after they've been conducted.
The COVID-19 pandemic and Americans' finances in 2020
The global coronavirus pandemic was the biggest news of 2020. No aspect of life went untouched, including personal finances.
Unemployment rose to 14.7% in April 2020 -- though the actual number could be even higher. Fortunately, the unemployment rate came back down to 6.9% in October.
In March, we surveyed American adults to ask how worried they were about their finances because of COVID. Over 60% said they were "somewhat" or "very" worried. And people were taking steps to ease their worry -- 42% were keeping more cash on hand, 37% were having more groceries and supplies delivered to their homes, and 26% were eating out less.
In June, we surveyed American adults who had lost income because of the coronavirus. We found that women, low-income earners, and non-white workers were hit hardest by income loss.
One-third of Americans who had lost income said they could go less than a month without the extra $600 in unemployment provided by the CARES Act. Respondents were preparing to cut their expenses, get side jobs, file for unemployment, and borrow more money.
Almost half of the people who had lost income said that it would take them at least six months to recover.
The data we've gathered also shows increases in personal and auto loans in hardship, including deferred payments and forbearance programs. In contrast, personal bankruptcies, credit card delinquencies, and mortgage foreclosures have decreased. This suggests that Americans are using assistance programs and raises questions about what will happen when those programs expire.
In short, COVID made American finances rather chaotic in 2020.
The numbers we report here are the best we've been able to find. But when employment, compensation, loans, and financial relief are all up in the air -- as they are now -- these things can change very quickly.
Average consumer household debt in 2020
Debt type | Total amount, Q3 2020 |
---|---|
Total consumer debt (including types not listed below) | $14.35 trillion |
Average (mean) household consumer debt | $145,000 |
Median household consumer debt | $67,000 |
Total mortgage debt | $9.86 trillion |
Total revolving home equity debt | $362 billion |
Total auto loan debt | $1.36 billion |
Total credit card debt | $807 billion |
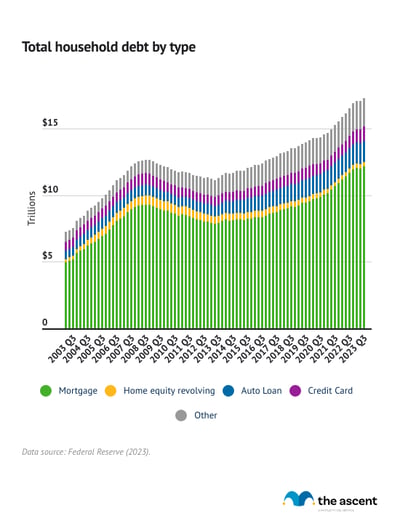
The New York Fed's quarterly Household Debt and Credit Survey (HHDC) shows that total consumer debt stands at $14.35 trillion as of the third quarter of 2020. That's a record high as far as the HHDC goes.
According to the 2019 Survey of Consumer Finances, the average (mean) household debt among those who had any debt was $140,416, while the median was $65,000. That includes a wide range of debt, from mortgages to personal loans, credit cards, and more.
Total debt has increased since 2019 -- we estimate the average (mean) household debt in 2020 to be around $145,000 and the median to be approximately $67,000 in 2020.
Average American debt payments in 2020: 8.69% of income
The St. Louis Federal Reserve tracks the nation's household debt payments as a percentage of household income. The most recent number, from the second quarter of 2020, is 8.69%.
That means the average American spends less than 9% of their monthly income on debt payments. That's a big drop from 9.69% in Q2 2019. This drop could be related to debt relief programs and other allowances made for coronavirus-related income loss -- though it could also indicate that consumers have paid off their high-interest debts.
Average credit card debt in 2020
Figure | Amount |
---|---|
Total credit card debt, Q3 2020 | $807 billion |
Average credit card balance, 2020 | $5,897 |
Average store card balance, 2020 | $2,044 |
Average (mean) revolving credit card balance, 2019 | $6,271 |
Average (median) revolving credit card balance, 2019 | $2,700 |
Delinquency rate of all credit card loans from commercial banks, Q2 2020 | 2.42% |
According to the latest Household Debt and Credit survey results from the New York Fed, Americans owe $807 billion in credit card debt as of Q3 2020. That's down from $881 billion in Q3 2019 and $817 billion in the second quarter of 2020.
This could be because Americans are spending a bit more conservatively with their credit cards than they were before the pandemic.
"Consumers tightened their belts in 2020, leading them to carry less revolving debt and focus on paying their credit card bills on time every month," says Melinda Opperman, President of Credit.org, a nonprofit HUD-approved housing and nationwide consumer credit counseling organization headquartered in Riverside, California.
"But those encouraging numbers are ironically a sign of financial instability; struggling families are cutting back wherever they can as we all brace for the fallout when foreclosure and eviction moratoriums end."
So what does that mean for individual credit card holders?
According to Experian's Oct. 20 report, Americans have an average of $5,897 in credit card debt spread over three cards. Americans also have 2.4 store credit cards, on average, with a total balance of $2,044.
Average revolving credit card balance in 2020: $6,271
A revolving credit card balance is one that persists between payments -- in other words, it's what people pay interest on. It's one of the most important figures when looking at credit card debt.
The latest figures reported on revolving credit card balances come from the 2019 SCF, which took place before COVID-19 threw our finances into a tailspin. But at the end of last year, the average (mean) revolving balance for cardholders who had a revolving balance was $6,271.
As we know, outliers can skew means, so we also report medians where we can. The median amount of revolving credit card balances in 2019 was $2,700. So some cardholders out there are revolving a lot more than $6,200.
Here's how the mean and median revolving credit card debt have changed over time:
Average household revolving credit card balance by race
Race | Average (mean) revolving credit card debt in 2019 | Average (median) revolving credit card debt in 2019 |
---|---|---|
White, non-Hispanic | $6,930 | $3,200 |
Hispanic | $5,597 | $1,850 |
Black / African-American | $3,878 | $1,300 |
Other | $6,894 | $3,000 |
All | $6,271 | $2,700 |
Average household revolving credit card balance by age group
Age group of reference person | Average (mean) revolving credit card debt in 2019 | Average (median) revolving credit card debt in 2019 |
---|---|---|
<35 | $3,660 | $1,900 |
35–44 | $5,991 | $2,700 |
45–54 | $7,672 | $3,200 |
55–64 | $6,884 | $3,000 |
65–74 | $7,033 | $2,850 |
>=75 | $8,078 | $2,700 |
All | $6,271 | $2,700 |
Editor's note: we're not reporting gender breakdowns of this metric, because the Survey of Consumer finances asks for household, not individual, data.
Delinquent credit card payments in 2020: 2.42%
Despite coronavirus-related financial woes, Americans remained surprisingly steady in paying their credit card bills on time. In the second quarter of 2020, the delinquency rate of credit card loans from commercial banks was 2.42%.
That's the lowest it's been since early 2017 -- and while it's possible that consumers are getting better about paying their debts, it seems more likely that it's related to credit card providers and banks letting borrowers postpone their payments and otherwise avoid delinquency.
Will that number go up as we face continued effects of the coronavirus pandemic? We'll have to see when the St. Louis Fed releases its Q3 data.
Average mortgage and HELOC debt in 2020
Figure | Amount |
---|---|
Total mortgage debt, Q3 2020 | $9.86 trillion |
Average mortgage debt, Oct. 2020 | $215,655 |
Average (mean) mortgage payment, 2019 | $1,487 |
Average (median) mortgage payment, 2019 | $1,200 |
Average mortgage rate, Nov. 5, 2020 | 2.78% |
Total home equity revolving debt, Q2 2020 | $362 billion |
Average (mean) HELOC value, (2019) | $49,929 |
Mortgage debt makes up the vast majority of American consumer debt at about 69%. That number has risen consistently since mid-2013. If we keep going at this rate, we'll hit $10 trillion of mortgage debt in a year or so.
So how much mortgage debt does the average American have? In their 2020 State of Credit Report, Experian reports that the average mortgage debt among Americans is $215,655.
That's slightly higher than the number in Experian's 2019 report: $213,599.
Average mortgage rate in 2020: 2.78%
2020 was a record year for mortgage rates, with the average 30-year fixed rate at 2.78% on Nov. 5. That's the lowest it's been since the St. Louis Fed started compiling this data in 1971.
These low rates have also led to a rush on refinances, especially before the new 0.5% refinance fee kicks in on Dec. 1.
Average mortgage payment in 2020: $1,487
The U.S. Census Bureau's American Housing Survey released its latest set of data in September, 2020. This data covers survey results from 2019.
According to this data, the average (mean) mortgage payment in 2019 was $1,487, while the median was $1,200.
Average HELOC amount in 2019: $49,929
Based on data from the 2019 Survey of Consumer Finances, the average (mean) value of a HELOC is $49,929, while the median is $24,000.
Average auto loan debt in 2020
Figure | Amount |
---|---|
Total auto loan debt, Q3 2020 | $1.36 trillion |
Average (mean) auto loan debt, 2019 | $17,553 |
Average (median) auto loan debt, 2019 | $13,000 |
Average monthly new car payment, Q2 2020 | $568 |
Average monthly used car payment. Q2 2020 | $397 |
Auto loan debt has been creeping up over the past several years, though we saw a slight dip in Q2 2020. Q3's $1.36 trillion is slightly higher than the $1.34 trillion total in Q2 and the $1.32 trillion in auto loan debt than we saw in Q3 2019.
What does that mean for individual borrowers? According to the 2019 SCF, the mean auto loan balance was $17,553 and the median was $13,000.
Average new car payment in 2020: $568
Experian's State of the Auto Finance Market report from Q2 2020 gives average car payments on new auto loans by credit score:
- Deep subprime (300–500): $562
- Subprime (501–600): $579
- Nonprime (601–660): $591
- Prime (661–780): $574
- Super prime (781–850): $541
- All: $568
Average used car payment in 2020: $397
Experian also reports used car payments by credit tier:
- Deep subprime (300–500): $414
- Subprime (501–600): $410
- Nonprime (601–660): $401
- Prime (661–780): $390
- Super prime (781–850): $389
- All: $397
Auto loans in hardship: 3.789%
TransUnion says that a loan is in hardship if the borrower has a deferred payment, forbearance program, frozen account, or frozen past due payment.
The credit bureau's monthly industry snapshot from September 2020 showed that 3.789% of auto loans were in financial hardship status. A year earlier, only 0.538% of auto loans were in hardship. That's an increase of 605%.
It seems quite likely that financial difficulties caused by the coronavirus and its attendant income loss have played a part in this change.
Average personal loan debt in 2020
Figure | Amount |
---|---|
Average unsecured personal loan amount, Sept. 2020 | $5,538 |
Average unsecured personal loan balance per consumer, Sept. 2020 | $9,074 |
Average finance rate on 24-month personal loans from commercial banks, Aug. 2020 | 9.34% |
Personal loans are versatile financial products. They can be used for a variety of financial needs, including weddings, renovations, vacations, or debt consolidation.
The SCF doesn't break out total personal loan debt as a separate category, so we can only say that it's part of the $417 billion "Other" category.
However, we can talk about the average personal loan debt.
According to TransUnion's September Monthly Industry Snapshot, the average unsecured personal loan amount was $5,538, down from $6,096 in September 2019.
The average balance per customer, however, is $9,074, indicating that many people who have one unsecured personal loan have at least one more. That's higher than the $8,989 per customer in September of last year.
Average personal loan interest rate in 2020: 9.34%
The St. Louis Federal Reserve tracks the average unsecured personal loan interest rate. In August 2020, the average interest rate for a 24-month loan was 9.34%.
That's the lowest it's been since February 1972, when the statistics start.
Personal loans in hardship: 4.377%
TransUnion says that a loan is in hardship if the borrower has a deferred payment, forbearance program, frozen account, or frozen past due payment.
In September 2020, 4.377% of unsecured personal loans were in hardship. In September 2019, 0.260% of personal loans had the same status. That's an increase of 1,580%.
There's no way to know for sure, but it seems very likely that the coronavirus pandemic had a hand in this increase.
American medical debt in 2020
Medical debt can be difficult to track. However, it's clear that it's a growing problem.
According to Urban Institute, 16% of Americans -- over 52 million people -- had medical debt in collections in 2017. That number is higher, 19%, in communities of color.
Some states have significantly higher numbers, too. For example, 31% of West Virginians have medical debt in collections.
The median debt also varies quite a bit. In the United States overall, the median medical debt in collections is $694. In Alaska, Wyoming, and West Virginia, though, that number is over $1,000 (Alaska's is highest at $1,316).
While statistics are scarce, it seems likely that rising healthcare costs -- especially during a global pandemic -- will have pushed these numbers higher.
State | Percentage of population with medical debt in collections | Median value of medical debt in collections |
---|---|---|
Alabama | 21% | $801 |
Alaska | 16% | $1,316 |
Arizona | 19% | $888 |
Arkansas | 22% | $596 |
California | 11% | $740 |
Colorado | 15% | $755 |
Connecticut | 12% | $441 |
Delaware | 18% | $601 |
Florida | 20% | $921 |
Georgia | 21% | $808 |
Hawaii | 8% | $232 |
Idaho | 14% | $790 |
Illinois | 16% | $555 |
Indiana | 20% | $761 |
Iowa | 13% | $535 |
Kansas | 18% | $735 |
Kentucky | 22% | $459 |
Louisiana | 27% | $697 |
Maine | 20% | $729 |
Maryland | 16% | $498 |
Massachusetts | 5% | $354 |
Michigan | 18% | $497 |
Minnesota | 3% | $360 |
Mississippi | 19% | $813 |
Missouri | 19% | $781 |
Montana | 15% | $768 |
Nebraska | 8% | $481 |
Nevada | 21% | $775 |
New Hampshire | 8% | $458 |
New Jersey | 15% | $510 |
New Mexico | 23% | $731 |
New York | 8% | $446 |
North Carolina | 24% | $698 |
North Dakota | 9% | $624 |
Ohio | 19% | $531 |
Oklahoma | 26% | $857 |
Oregon | 10% | $647 |
Pennsylvania | 13% | $512 |
Rhode Island | 7% | $468 |
South Carolina | 27% | $787 |
South Dakota | 4% | $542 |
Tennessee | 22% | $855 |
Texas | 25% | $829 |
Utah | 15% | $997 |
Vermont | 7% | $469 |
Virginia | 18% | $680 |
Washington | 6% | $559 |
Washington, D.C. | 10% | $488 |
West Virginia | 31% | $680 |
Wisconsin | 15% | $1,015 |
Wyoming | 19% | $1,252 |
United States | 16% | $694 |
Note that Urban Institute's data for these figures comes from a combination of 2018 and 2017 statistics. Debt.org reports that medical debt rose almost 20% in the five years leading up to 2017, so it's a safe bet that these numbers are all significantly higher in 2020.
Bankruptcy, delinquencies, charge-offs, and foreclosures in 2020
When Americans can't handle their debts, we see foreclosures, bankruptcies, delinquencies, and charge-offs. When those numbers go up, it's clear that Americans' personal finances are in trouble.
So what happened this year?
2020 personal bankruptcy statistics
According to the American Bankruptcy Institute's most recent release, there were 420,048 declarations of bankruptcy in the United States by the end of September 2020.
Interestingly, that's 28% less than the number we saw at this point in 2019.
Of course, many organizations are helping U.S. consumers avoid bankruptcy with financial assistance during the coronavirus pandemic. The effects of the pandemic-driven recession will become more clear when some of those protections run out over the course of the next year.
Personal bankruptcies in 2020 by state
Here are the 2020 filings per capita of all 50 states and D.C. up to the end of September 2020. The total number of year-to-date (YTD) personal bankruptcy filings per capita in the country as a whole is 1.78.
State | YTD personal bankruptcy filings per capita (October 2020) |
---|---|
Alabama | 4.00 |
Delaware | 3.71 |
Tennessee | 3.54 |
Mississippi | 3.01 |
Nevada | 2.99 |
Georgia | 2.90 |
Utah | 2.79 |
Indiana | 2.73 |
Kentucky | 2.66 |
Arkansas | 2.65 |
Illinois | 2.46 |
Ohio | 2.39 |
Michigan | 2.18 |
Virginia | 2.15 |
Missouri | 2.15 |
Wisconsin | 2.11 |
Maryland | 2.05 |
Oklahoma | 2.05 |
Arizona | 2.03 |
Florida | 2.02 |
Nebraska | 1.84 |
Idaho | 1.82 |
Oregon | 1.73 |
Colorado | 1.71 |
New Jersey | 1.70 |
Louisiana | 1.69 |
Kansas | 1.60 |
Minnesota | 1.44 |
California | 1.40 |
Rhode Island | 1.33 |
Iowa | 1.30 |
Washington | 1.30 |
West Virginia | 1.28 |
New Mexico | 1.26 |
Wyoming | 1.25 |
Connecticut | 1.20 |
Hawaii | 1.18 |
Pennsylvania | 1.14 |
New York | 1.10 |
Texas | 1.09 |
South Carolina | 1.07 |
North Dakota | 1.05 |
South Dakota | 1.03 |
North Carolina | 0.97 |
Montana | 0.96 |
District of Columbia | 0.89 |
New Hampshire | 0.84 |
Maine | 0.80 |
Massachusetts | 0.68 |
Vermont | 0.66 |
Alaska | 0.44 |
Charge-off and delinquency rates on consumer loans in 2020: 1.98%
The Federal Reserve Board collects statistics on charge-offs and delinquencies by loan type. Here's how they've changed over the past 20 years:
Year and quarter | All real estate loans | All consumer loans | Consumer credit cards | Total loans and leases |
---|---|---|---|---|
2020:2 | 1.73 | 1.98 | 2.42 | 1.54 |
2020:1 | 1.62 | 2.47 | 2.71 | 1.49 |
2019:4 | 1.56 | 2.36 | 2.62 | 1.45 |
2019:3 | 1.59 | 2.33 | 2.6 | 1.46 |
2019:2 | 1.66 | 2.33 | 2.57 | 1.49 |
2019:1 | 1.75 | 2.33 | 2.55 | 1.53 |
2018:4 | 1.82 | 2.35 | 2.55 | 1.54 |
2018:3 | 1.9 | 2.29 | 2.51 | 1.6 |
2018:2 | 2 | 2.25 | 2.48 | 1.64 |
2018:1 | 2.16 | 2.27 | 2.51 | 1.71 |
2017:4 | 2.25 | 2.25 | 2.49 | 1.8 |
2017:3 | 2.29 | 2.26 | 2.54 | 1.82 |
2017:2 | 2.28 | 2.21 | 2.48 | 1.84 |
2017:1 | 2.4 | 2.17 | 2.4 | 1.93 |
2016:4 | 2.62 | 2.16 | 2.37 | 2.04 |
2016:3 | 2.72 | 2.07 | 2.29 | 2.06 |
2016:2 | 2.86 | 2.05 | 2.21 | 2.14 |
2016:1 | 3 | 1.99 | 2.15 | 2.17 |
2015:4 | 3.22 | 2.01 | 2.16 | 2.2 |
2015:3 | 3.44 | 2 | 2.15 | 2.28 |
2015:2 | 3.73 | 1.98 | 2.12 | 2.39 |
2015:1 | 4.03 | 2.01 | 2.11 | 2.49 |
2014:4 | 4.31 | 2.09 | 2.15 | 2.71 |
2014:3 | 4.69 | 2.2 | 2.2 | 2.9 |
2014:2 | 4.99 | 2.27 | 2.26 | 3.08 |
2014:1 | 5.32 | 2.32 | 2.32 | 3.31 |
2013:4 | 5.77 | 2.37 | 2.38 | 3.52 |
2013:3 | 6.09 | 2.4 | 2.44 | 3.77 |
2013:2 | 6.74 | 2.48 | 2.53 | 4.14 |
2013:1 | 7.22 | 2.56 | 2.64 | 4.41 |
2012:4 | 7.52 | 2.63 | 2.71 | 4.65 |
2012:3 | 8.05 | 2.78 | 2.82 | 5.04 |
2012:2 | 8.12 | 2.84 | 2.92 | 5.12 |
2012:1 | 8.2 | 2.93 | 3.06 | 5.27 |
2011:4 | 8.53 | 3.07 | 3.25 | 5.46 |
2011:3 | 8.8 | 3.13 | 3.45 | 5.7 |
2011:2 | 8.96 | 3.27 | 3.65 | 5.96 |
2011:1 | 9.03 | 3.43 | 3.82 | 6.2 |
2010:4 | 9.2 | 3.63 | 4.14 | 6.38 |
2010:3 | 9.57 | 4 | 4.58 | 6.89 |
2010:2 | 9.93 | 4.25 | 5.1 | 7.21 |
2010:1 | 10.21 | 4.72 | 5.78 | 7.4 |
2009:4 | 9.45 | 4.59 | 6.33 | 7.3 |
2009:3 | 8.91 | 4.7 | 6.49 | 6.94 |
2009:2 | 8.12 | 4.85 | 6.77 | 6.37 |
2009:1 | 7.26 | 4.67 | 6.51 | 5.64 |
2008:4 | 6 | 4.27 | 5.64 | 4.75 |
2008:3 | 4.92 | 3.71 | 4.8 | 3.72 |
2008:2 | 4.19 | 3.56 | 4.9 | 3.32 |
2008:1 | 3.53 | 3.49 | 4.77 | 2.86 |
2007:4 | 2.89 | 3.4 | 4.6 | 2.47 |
2007:3 | 2.38 | 3.2 | 4.41 | 2.14 |
2007:2 | 2 | 2.99 | 4.02 | 1.87 |
2007:1 | 1.79 | 2.93 | 3.98 | 1.74 |
2006:4 | 1.69 | 2.94 | 3.95 | 1.69 |
2006:3 | 1.5 | 2.96 | 4.12 | 1.58 |
2006:2 | 1.37 | 2.92 | 4.13 | 1.51 |
2006:1 | 1.36 | 2.78 | 3.86 | 1.51 |
2005:4 | 1.42 | 2.69 | 3.54 | 1.54 |
2005:3 | 1.4 | 2.8 | 3.9 | 1.56 |
2005:2 | 1.37 | 2.85 | 3.67 | 1.57 |
2005:1 | 1.33 | 2.91 | 3.7 | 1.6 |
2004:4 | 1.31 | 3.03 | 4.03 | 1.64 |
2004:3 | 1.42 | 3.05 | 4.07 | 1.74 |
2004:2 | 1.49 | 3.1 | 4.15 | 1.86 |
2004:1 | 1.52 | 3.13 | 4.21 | 1.96 |
2003:4 | 1.66 | 3.28 | 4.43 | 2.15 |
2003:3 | 1.69 | 3.1 | 4.24 | 2.22 |
2003:2 | 1.79 | 3.31 | 4.53 | 2.42 |
2003:1 | 1.89 | 3.42 | 4.68 | 2.54 |
2002:4 | 1.89 | 3.45 | 4.84 | 2.57 |
2002:3 | 1.97 | 3.49 | 4.89 | 2.69 |
2002:2 | 2.04 | 3.51 | 4.78 | 2.75 |
2002:1 | 2.1 | 3.6 | 4.94 | 2.75 |
2001:4 | 2.17 | 3.64 | 4.69 | 2.74 |
2001:3 | 2.15 | 3.72 | 5 | 2.72 |
2001:2 | 2.16 | 3.68 | 4.94 | 2.55 |
2001:1 | 2.06 | 3.63 | 4.81 | 2.42 |
2000:4 | 1.97 | 3.63 | 4.57 | 2.34 |
2000:3 | 1.89 | 3.56 | 4.53 | 2.2 |
2000:2 | 1.8 | 3.53 | 4.51 | 2.14 |
2000:1 | 1.8 | 3.47 | 4.43 | 2.08 |
As you can see, residential and commercial real estate loans have had more charge-offs and delinquencies in Q2 2020 than they did in Q1, though the rates are notably lower than they were in previous years.
The delinquency and charge-off rate for consumer loans (which includes credit cards) was 1.98% in Q2, while the overall rate, which includes real estate and commercial loans, was 1.54%. The consumer delinquency and charge-off rate is notably lower than the 2.47% from Q1, which may be a reflection of relief measures put in place by companies in response to coronavirus-related income loss.
Again, these figures can take time to adjust to new economic conditions, so we may see changes in the coming months.
Foreclosures in 2020
Interestingly, foreclosures are way down in 2020. There's no federal-level foreclosure data easily available, but ATTOM Data's foreclosure report shows that there were around 50,000 foreclosures in November 2019. The number was closer to 10,000 in September 2020.
While Americans are facing a great deal of financial hardship, many eviction and foreclosure moratoria have been put into place this year. Many borrowers are also able to put their mortgages into forbearance for 180 days with the option to extend it another 180 days.
"The moratoria on evictions and foreclosures easily explain why foreclosure rates are down, and they also create some dread for 2021," says Credit.org's Opperman. "Every expert expects a sharp rise in eviction rates and foreclosures next year."
Sources
- American Bankruptcy Institute (2020). "October 2020 Bankruptcy Statistics- State and District."
- Braga, Breno, Signe-Mary McKernan, and Caleb Quakenbush (2017). Urban Institute "Debt in America: An Interactive Map."
- Debt.org (n.d.). "Medical Debt Relief."
- Experian (2020). "Automotive Industry Insights: Finance Market Report Q2 2020."
- Federal Reserve Bank of New York (2020). "Household Debt and Credit."
- Federal Reserve Bank of St. Louis (2020). "30-Year Fixed Rate Mortgage Average in the United States."
- Federal Reserve Bank of St. Louis (2020). "Delinquency Rate on Credit Card Loans, All Commercial Banks."
- Federal Reserve Bank of St. Louis (2020). "Finance Rate on Personal Loans at Commercial Banks, 24 Month Loan."
- Federal Reserve Bank of St. Louis (2020). "Household Debt Service Payments as a Percent of Disposable Personal Income."
- Federal Reserve Board (2020). "Charge-Off and Delinquency Rates on Loans and Leases at Commercial Banks."
- Federal Reserve Board (2020). "Survey of Consumer Finances (SCF)."
- RealtyTrac (2020). "U.S. Real Estate Trends & Market Info: Foreclosure Trends."
- TransUnion (2020). "September 2020 Monthly Industry Snapshot."
- U.S. Bureau of Labor Statistics (2020). "Civilian unemployment rate."
- U.S. Census Bureau (2020). "American Housing Survey (AHS) Table Creator: 2019 National - Additional Mortgage Characteristics - Owner-occupied Units."
- Wendel, Stefani (2020). Experian. "State of Credit 2020: Consumer Credit During COVID-19."
- Wendel, Stefani (2019). Experian. "State of Credit 2019: Rounding Out the Decade."
Recent Research
We're firm believers in the Golden Rule, which is why editorial opinions are ours alone and have not been previously reviewed, approved, or endorsed by included advertisers. The Ascent does not cover all offers on the market. Editorial content from The Ascent is separate from The Motley Fool editorial content and is created by a different analyst team. The Motley Fool has a Disclosure Policy. The Author and/or The Motley Fool may have an interest in companies mentioned.