Airlines are an important part of the economy, but their stocks have often been lousy investments. Airline stock prices move with economic cycles, and past downturns have caused airline bankruptcies and failures.
Industry consolidation, however, has created a small group of competitors that are more effectively using technology to manage schedules and set fares. Today, four airlines control about 80% of the U.S. market.

Airlines in a post-pandemic world
The COVID-19 pandemic temporarily caused airline revenues and share prices to fall. Vaccines had people traveling again, but the recovery was choppy as new variants disrupted normal travel patterns.
Travel demand returned with a vengeance in 2022, creating a summer of congested airports and lost baggage. The upswing in demand has held strong so far in 2023. Airline revenue is sky-high as a result, and some of the largest carriers have returned to profitability for the first time since the pandemic.
The pandemic caused changes in travel demand patterns that -- if they hold -- should give the airlines a boost for years to come. The shift to "work from home" and "work from anywhere" has created year-round demand for leisure travel, helping to smooth out what has historically been a highly cyclical industry where demand spikes in the summer and falls flat in January.
But new headwinds have complicated matters. The conflict in Ukraine and the corresponding spike in oil prices has kept much of that added revenue from hitting the bottom line since fuel accounts for as much as 30% of an airline’s total costs. The airlines are also struggling to find pilots, one of the reasons for summer cancellation headlines.
U.S. airlines survived the pandemic without any major bankruptcies, and the major ones appear healthy enough to continue to fly through the economic turbulence.
Still, it will likely take time for conditions to normalize. The International Air Transport Association, the airline industry’s trade organization, predicted a full recovery might not happen until 2024 -- a forecast made before Russia’s invasion of Ukraine.
The best airline stocks to buy right now
The best airline stocks to buy right now
| Airline | Ticker | Market Capitalization |
|---|---|---|
| Delta Air Lines |
(NYSE:DAL) |
$30.2 billion |
| Southwest Airlines |
(NYSE:LUV) |
$16.9 billion |
| United Airlines Holdings | $14.9 billion | |
| Alaska Air Group |
(NYSE:ALK) |
$5.3 billion |
| Frontier Group Holdings | $1.6 billion |
Airlines in the U.S. fall into three categories:
- Full-service companies, which fly globally, have different cabin classes, and serve many markets.
- Discounters, which offer few frills and service few destinations.
- Regional airlines, which provide small-jet service to secondary markets under the brands of full-service partners.
There are about a dozen publicly traded airlines in the U.S. Here are some of our top picks:
1. Delta Air Lines
This airline is the driving force behind much of the recent innovation in the industry. Atlanta-based Delta kicked off a round of consolidations that helped stabilize the business when it acquired Northwest Airlines in 2008, and it has revamped pricing to better compete with discounters. Delta even bought an oil refinery to help ensure its access to jet fuel supplies.
More recently, Delta was out in front of the pack when it comes to forging a new labor deal with its all-important pilots group. Where Delta goes, its rivals follow.
Post-pandemic Delta has a stable balance sheet and relatively strong labor relations, making it a good choice to be among the first international carriers to fully recover.
2. Southwest Airlines
Southwest Airlines was the original discounter, but it is now one of the titans of the industry and no longer a maverick start-up. The Dallas-based airline remains the only major carrier never to land in bankruptcy court, and its simplified operations have a track record of remaining profitable even when rivals struggle.
Southwest's pristine reputation has taken a few hits since the pandemic. The airline had a high-profile schedule meltdown during the 2022 holiday season, and issues with its aging IT infrastructure led to another systemwide grounding of planes in April.
But even if this is not the Southwest of old, the airline is by and large a reliable operator that remains a cost leader. It also has the industry’s best balance sheet, making it an investor favorite for its ability to survive.
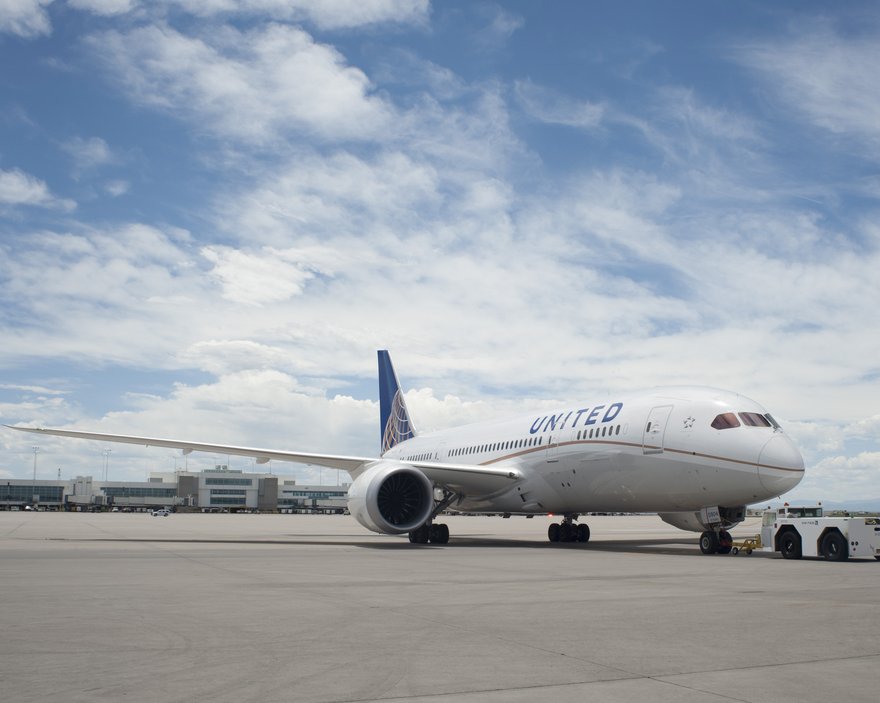
3. United Airlines Holdings
United has large operations catering to Silicon Valley and the U.S. energy sector, as well as a massive network throughout Asia. The highly cyclical nature of those markets means that United's results can ebb and flow with tech or energy.
United, which is based in Chicago, historically was the envy of the industry due to its large presence in key business markets and its ability to offer unrivaled connections to corporate travelers. Its advantage waned during the pandemic, but its network is still a key United advantage.
Importantly for investors, this long-time underperformer now has a stable and progressive management team that has done a good job modernizing its long-sleepy operation.
4. Alaska Air Group
Alaska, as its name suggests, has largely been focused on the U.S. Pacific Northwest for much of its history. But thanks to its 2016 purchase of Virgin America, the company is now a major player down the West Coast into southern California, and has a transcontinental business as well.
Alaska has historically partnered with its bigger rivals, giving its customers access to the entire globe and its partners more service to small Pacific Northwest markets. These days, Alaska is tied most closely to American Airlines Group (AAL -1.77%).
Through the years Alaska has developed a reputation as a solid operator that has outperformed its larger rivals. The airline experienced some hiccups when integrating Virgin America, but has regained altitude and once again ranks as one of the most intriguing investments in the sector.
5. Frontier Group Holdings
Frontier is one of a new breed of discount carriers who provide very little other than a seat for the price of a ticket, charging for small frills like beverages and carry-on bags that other airlines provide for free.
The business model is the subject of a lot of complaints and jokes, but price-sensitive consumers pack the planes. And thanks to its low cost structure, Frontier can win a price war against almost any other carrier in its market.
Frontier is unlikely to ever join the ranks of global airlines like Delta or United, and might never enjoy the scale of Southwest. But it offers a niche product that has made it the fastest growing airline in the U.S., and has a large book of jets on order for future expansion.
Airline ETFs
There are also airline ETFs
If you’re bullish on airlines but would rather not choose among individual stocks, lower-risk investments such as exchange-traded funds (ETFs) also cover the airline sector. The U.S. Global Jets ETF (JETS -0.05%) is specifically focused on airlines, while the iShares Transportation Average ETF (IYT -1.26%) and the SPDR S&P Transportation ETF (XTN -1.25%) each allocate more than 25% of their holdings to airlines.
Trends
Trends in the air travel industry
The competitive landscape among airlines is constantly changing. In 2021, two airlines -- Sun Country Airlines (SNCY -3.53%) and Frontier -- tapped public markets for expansion capital via initial public offerings. And last year, Frontier and JetBlue Airways (JBLU 1.05%) engaged in a bidding war for Spirit Airlines (SAVE 0.0%) in an effort to create a new discount powerhouse.
JetBlue won the bidding war, but its deal with Spirit faces an uphill climb to win regulatory approval. It's not yet clear whether other airlines will follow the same path toward more consolidation. But investors should expect more change and potentially new competition in the years ahead.
Downturns tend to be good times for new airlines to emerge or for discounters to grow because airplanes tend to be available on the cheap.
Understanding the airline sector
Investors should understand several airline-specific terms before buying any stock. Here's what you need to know:
RASM
Short for revenue per available seat-mile, RASM is a measure of airline profitability. A company's seat-miles is the number of seats an airline has made available multiplied by the number of miles the airline's jets flew. Dividing revenue by seat-miles equals an airline's RASM.
RASM is important because all flights have different fare and cost structures depending on many variables, including flight distance and aircraft type. Simply looking at total revenue or expenses won’t give you the full picture.
An airline's RASM helps to indicate whether it is selling tickets at any price just to fill seats or if it has enough pricing power to sell seats for profit. Two different airlines could both have full airplanes, but as an investor, you want to focus on the one able to do it with strong margins.
CASM
Short for costs per available seat-mile, CASM is an airline’s total costs divided by number of available seats, then multiplied by miles flown. It measures expenses the way RASM measures sales.
Load factor
Load factor measures how well an airline is filling its seats. For an individual flight, it is as simple as saying 60 of 79 seats were full. But for a major airline, that simple definition doesn’t tell the full story because of differences in flight times. Airlines calculate their systemwide load factor by measuring how many seats were filled for each mile flown. Major airlines will provide this information on earnings releases and conference calls, but investors can calculate it at home by dividing revenue passenger miles -- as mentioned above, the number of passengers on a flight times the number of miles flown -- by the available seat miles.
Related investing topics
Are airline stocks for you?
The airline industry remains cyclical, but the pandemic proved the companies are now strong enough to withstand tough operating conditions without having to fly into bankruptcy.
If you are bullish on long-term demand for travel, buying into a well-run airline is a way for your investment dollars to go along for the ride.


