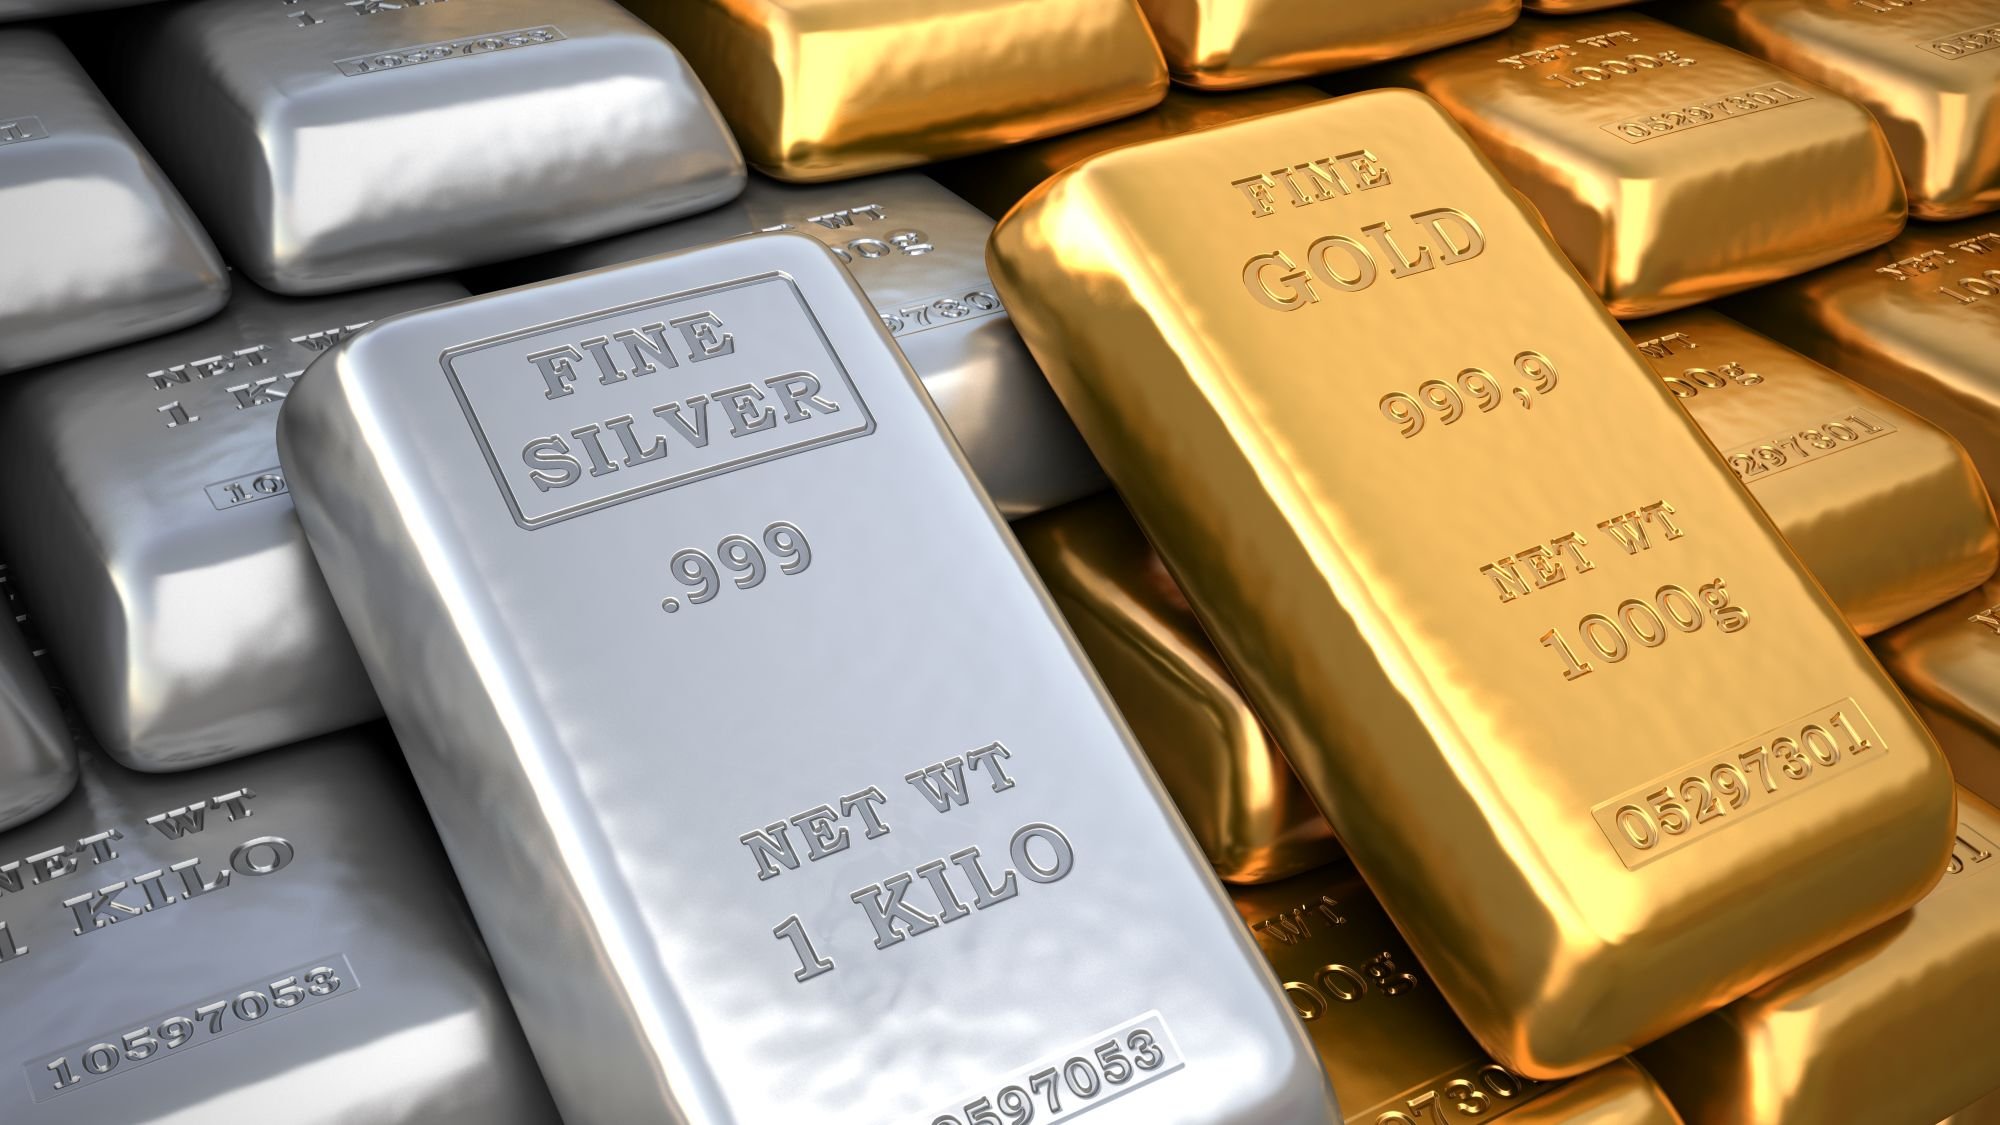
Investors choosing between SPDR Gold Shares (GLD +1.00%) and iShares Silver Trust (SLV +1.86%) must weigh the lower costs and relative stability of gold against the higher volatility and recent momentum of silver.
Precious metals often serve as a hedge against inflation, currency devaluation, or geopolitical uncertainty. While both funds bypass the logistical hurdles of physical storage by holding bullion in secure vaults, they track different commodities with distinct industrial and monetary drivers. This analysis compares how their costs, historical volatility, and assets under management differ for investors.
Snapshot (cost & size)
| Metric | SLV | GLD |
|---|---|---|
| Issuer | iShares | SPDR |
| Share price | $55.02 (as of 2026-07-02) | $378.13 (as of 2026-07-02) |
| Expense ratio | 0.50% | 0.40% |
| 1-yr return (as of 2026-07-02) | 65.50% | 22.30% |
| Dividend yield | None | None |
| Beta | 0.49 | 0.17 |
| AUM | $28.6 billion | $132.9 billion |
Beta measures price volatility relative to the S&P 500; beta is calculated from five-year monthly returns. The 1-yr return represents total return over the trailing 12 months.
The SPDR gold trust is more cost-efficient for long-term holders, featuring an expense ratio of 0.40%. This is lower than the 0.50% fee charged by the iShares silver trust, representing a savings of $1.00 per year for every $1,000 invested.
Performance & risk comparison
| Metric | SLV | GLD |
|---|---|---|
| Max drawdown (5 yr) | (51.00%) | (26.20%) |
| Growth of $1,000 over 5 years (total return) | $2,241 | $2,260 |
What's inside
SPDR Gold Shares provides exposure to the price of gold bullion by holding physical assets in secure vaults. Its largest positions include Physical Gold at 100.00%. The fund was launched in 2004. It tracks the price of gold after deducting operational expenses and serves as a highly liquid instrument for institutional and retail investors seeking a direct gateway to the gold market without the complexities of physical delivery.
iShares Silver Trust seeks to replicate the market price movements of silver bullion by holding physical metal. Its largest positions include Physical Silver at 100.00%. This trust was launched in 2006. Silver dual role as both a precious and industrial metal often leads to higher price volatility than gold, a characteristic reflected in the fund higher historical beta and more significant historical price swings.
For more guidance on ETF investing, check out the full guide at this link.
| Metric | SLV | GLD |
|---|---|---|
| Max drawdown (5 yr) | (51.00%) | (26.20%) |
| Growth of $1,000 over 5 years (total return) | $2,241 | $2,260 |
What investors should know
As previously mentioned, SLV and GLD reflected the market prices of silver and gold, respectively. This means both could serve as a hedge against inflation, and with both precious metal ETFs in a long-term bull market, investors should note that both have also outperformed the S&P 500’s total return.

NYSEMKT: SLV
Key Data Points
Nonetheless, choosing between SLV and GLD comes down to risk profiles. Although SLV has an expense ratio that is 10 basis points higher, it offered considerably higher yields over the last year. That stood in contrast to the five-year performance, where GLD earned slightly higher returns.

NYSEMKT: GLD
Key Data Points
In this case, investors should keep the much higher volatility of silver in mind. Despite the 65.5% overall return over the last year, a price spike meant that return rose as high as 217%. Thus, investors who bought at that peak may still be dealing with considerable losses.
In comparison, GLD’s gain for the year peaked at around 60%, so even if one bought at the peak, the percentage losses would be lower.
Additionally, when also considering GLD’s higher five-year returns, one could argue that buying SLV may not be worth the higher volatility risks and the larger expense ratio.